CFD / Laminar flow
Lid-driven cavity
Ghia, Ghia and Shin (1982)
Criterion met
Quantitative comparison
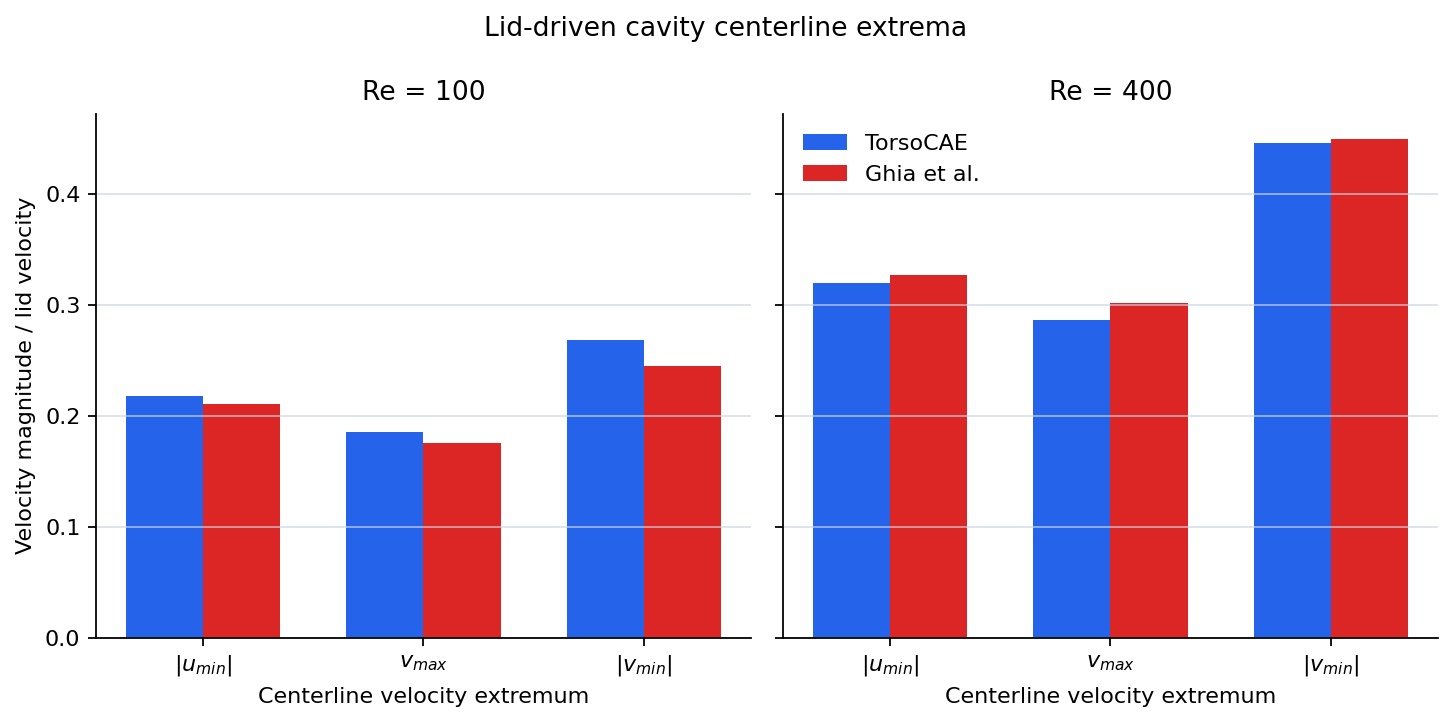
Centerline extrema: 0.8-9.4% relative deviation
Geometry
1.0 m square cavity with a 0.1 m quasi-2D depth.
Model parameters
Re = 100 and 400; lid velocity U = 1 m/s; P2/P1 incompressible formulation; approximately 30 cells per side.
Assessment method
Centerline velocity extrema, signs, and circulation direction are compared with the published reference. The acceptance criterion covers bulk extrema and circulation topology; near-wall peak locations are reported separately because the mesh is not wall-refined.
Overview
Validated against Ghia, Ghia and Shin (1982).
Reference: Ghia, U., Ghia, K.N., Shin, C.T. (1982), J. Comput. Phys. 48(3), 387-411
Headline comparison — Centerline extrema: 0.8-9.4% relative deviation.
Geometry and simulation setup
1.0 m square cavity with a 0.1 m quasi-2D depth.
Re = 100 and 400; lid velocity U = 1 m/s; P2/P1 incompressible formulation; approximately 30 cells per side.
Parameter values
| Parameter | Value |
|---|
| U lid m s | 1 |
| L m | 1 |
| DZ m | 0.1 |
Results
v_max_x/v_min_x are reported but not gated on tight numeric agreement -- near-wall peak location is far more resolution-sensitive than bulk magnitude on this single, non-wall-refined mesh (~30 elements/side vs. Ghia's 129x129 grid); gated instead on qualitative circulation direction (v_max on the side nearer x=0, v_min nearer x=L), independently re-derived from first principles (lid drags +x at top -> turns down at right wall -> left along bottom -> up at left wall -> clockwise circulation).
| Quantity | Value |
|---|
| Value tolerance (%) | 20 |
| Location tolerance (%) | 25 |
| Per run pass | Yes, Yes |
| Pass | Yes |
Runs
| Re | N nodes | N vcenter samples | N hcenter samples | Elapsed s |
|---|
| 100 | 25,529 | 202 | 207 | 502.301 |
| 400 | 25,529 | 202 | 207 | 607.495 |
Assessment
Centerline velocity extrema, signs, and circulation direction are compared with the published reference. The acceptance criterion covers bulk extrema and circulation topology; near-wall peak locations are reported separately because the mesh is not wall-refined.
CFD / Transient laminar flow
Karman vortex street
Roshko and Williamson Strouhal range
Criterion met
Quantitative comparison
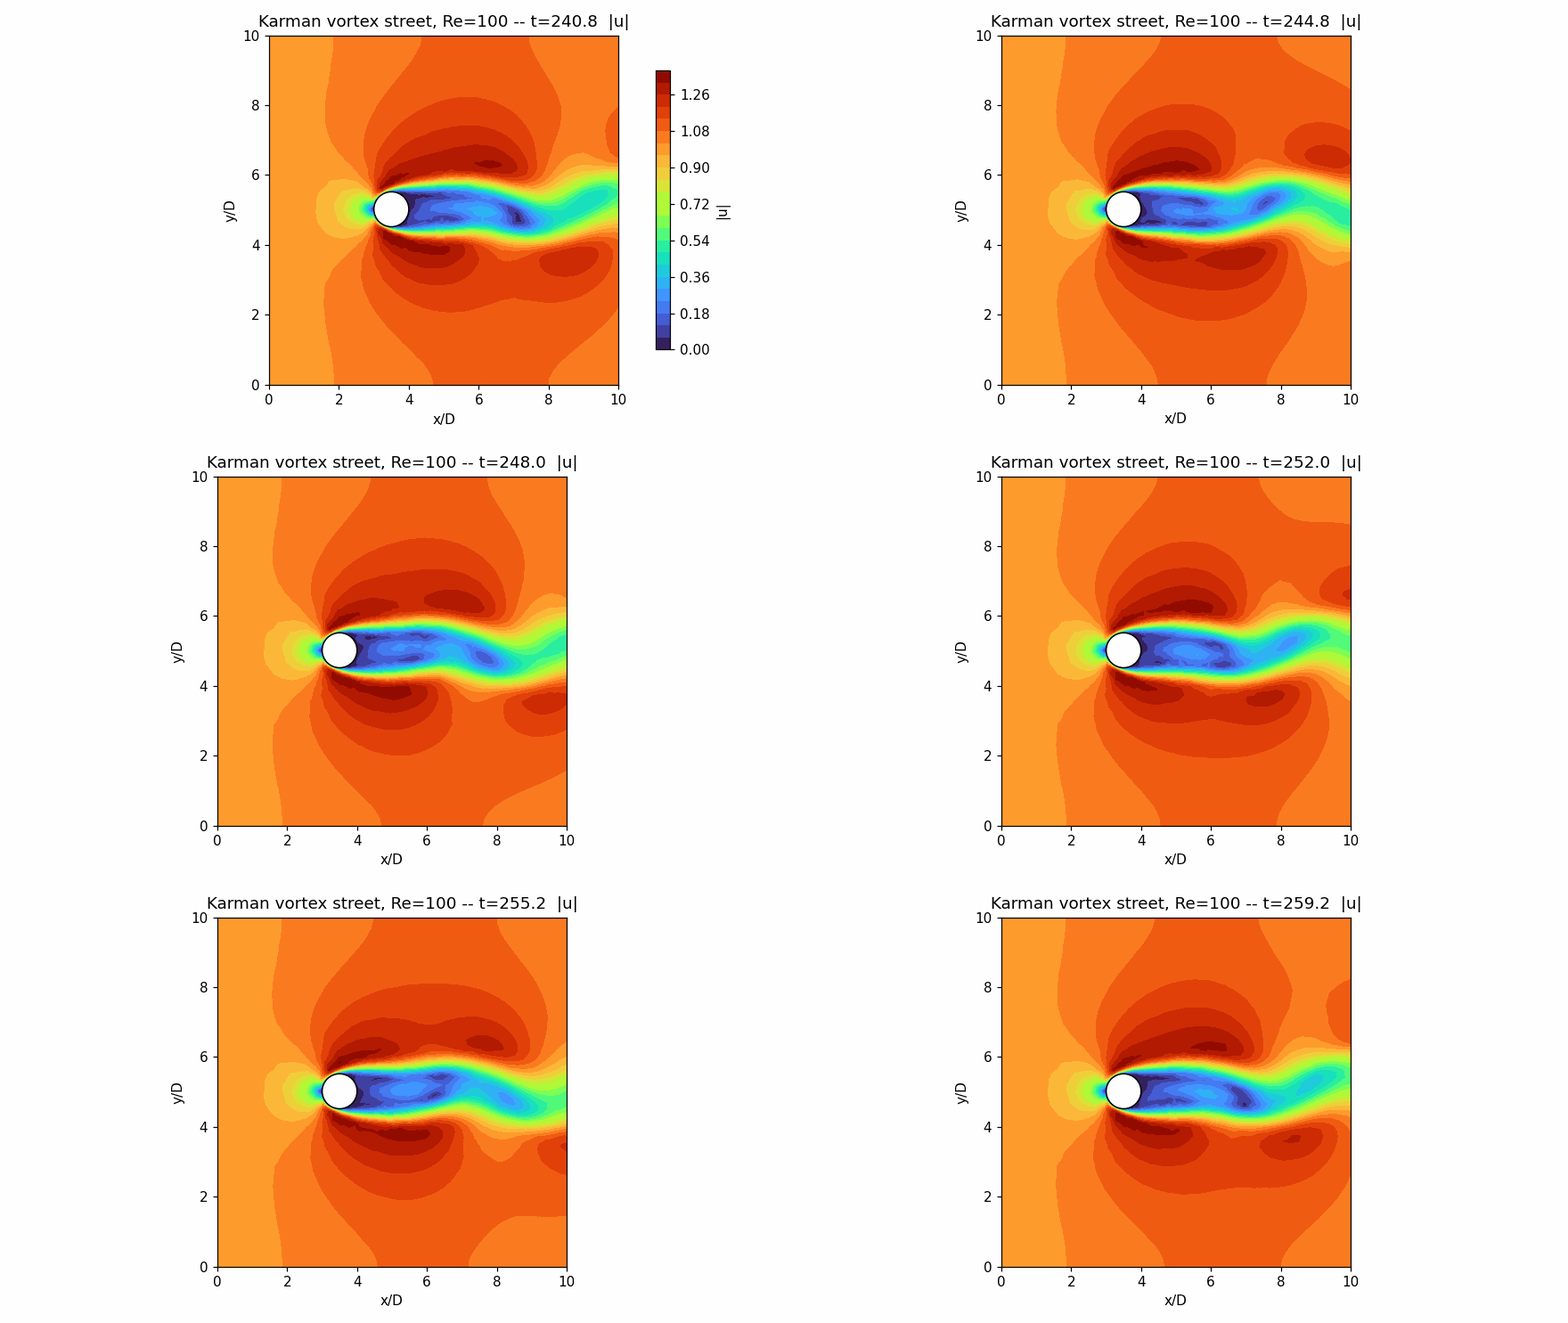
Strouhal number St = 0.1603 (reference interval 0.16-0.17)
Geometry
Circular cylinder in a widened quasi-2D cross-flow channel.
Model parameters
Re = 100; transient incompressible flow; force history sampled after shedding reaches a stationary amplitude.
Assessment method
The shedding frequency is extracted from the statistically stationary lift history. A controlled domain-width study quantifies blockage sensitivity before comparison with the reference interval.
Overview
Validated against Roshko and Williamson Strouhal range.
Reference: St = f*D/U at Re=100 ~ 0.16-0.17 (Roshko 1954; Williamson 1996 review)
Headline comparison — Strouhal number St = 0.1603 (reference interval 0.16-0.17).
Geometry and simulation setup
Circular cylinder in a widened quasi-2D cross-flow channel.
Re = 100; transient incompressible flow; force history sampled after shedding reaches a stationary amplitude.
Parameter values
| Parameter | Value |
|---|
| U | 1 |
| Re | 100 |
| Num steps | 1,200 |
| Dt | 0.2 |
| Elapsed s | 5,002.5427 |
| Tail fraction | 0.5 |
| Period | 6.2375 |
| Amplitude first half of tail | 0.0161 |
| Amplitude second half of tail | 0.0163 |
| Amplitude stationary | Yes |
| St | 0.1603 |
| Fx settled mean | -0.3456 |
| D m | 1 |
| LX m | 10 |
| LY m | 10 |
| DZ m | 0.5 |
| Blockage ratio | 0.1 |
| Mu | 0.01 |
| Rho | 1 |
| N nodes | 12,764 |
| Cyl tag | 7 |
| Cyl elements | 256 |
| Size max | 0.4 |
| Cyl size | 0.125 |
| Cyl transition | 0.8 |
Results
| Quantity | Value |
|---|
| St reference band | 0.16, 0.17 |
| St in band | Yes |
| Pass | Yes |
Assessment
The shedding frequency is extracted from the statistically stationary lift history. A controlled domain-width study quantifies blockage sensitivity before comparison with the reference interval.
CFD / DGFV volume of fluid
Dry-bed dam break
Lobovsky et al. (2014) surge-front experiment
Refined-grid criterion met
Quantitative comparison
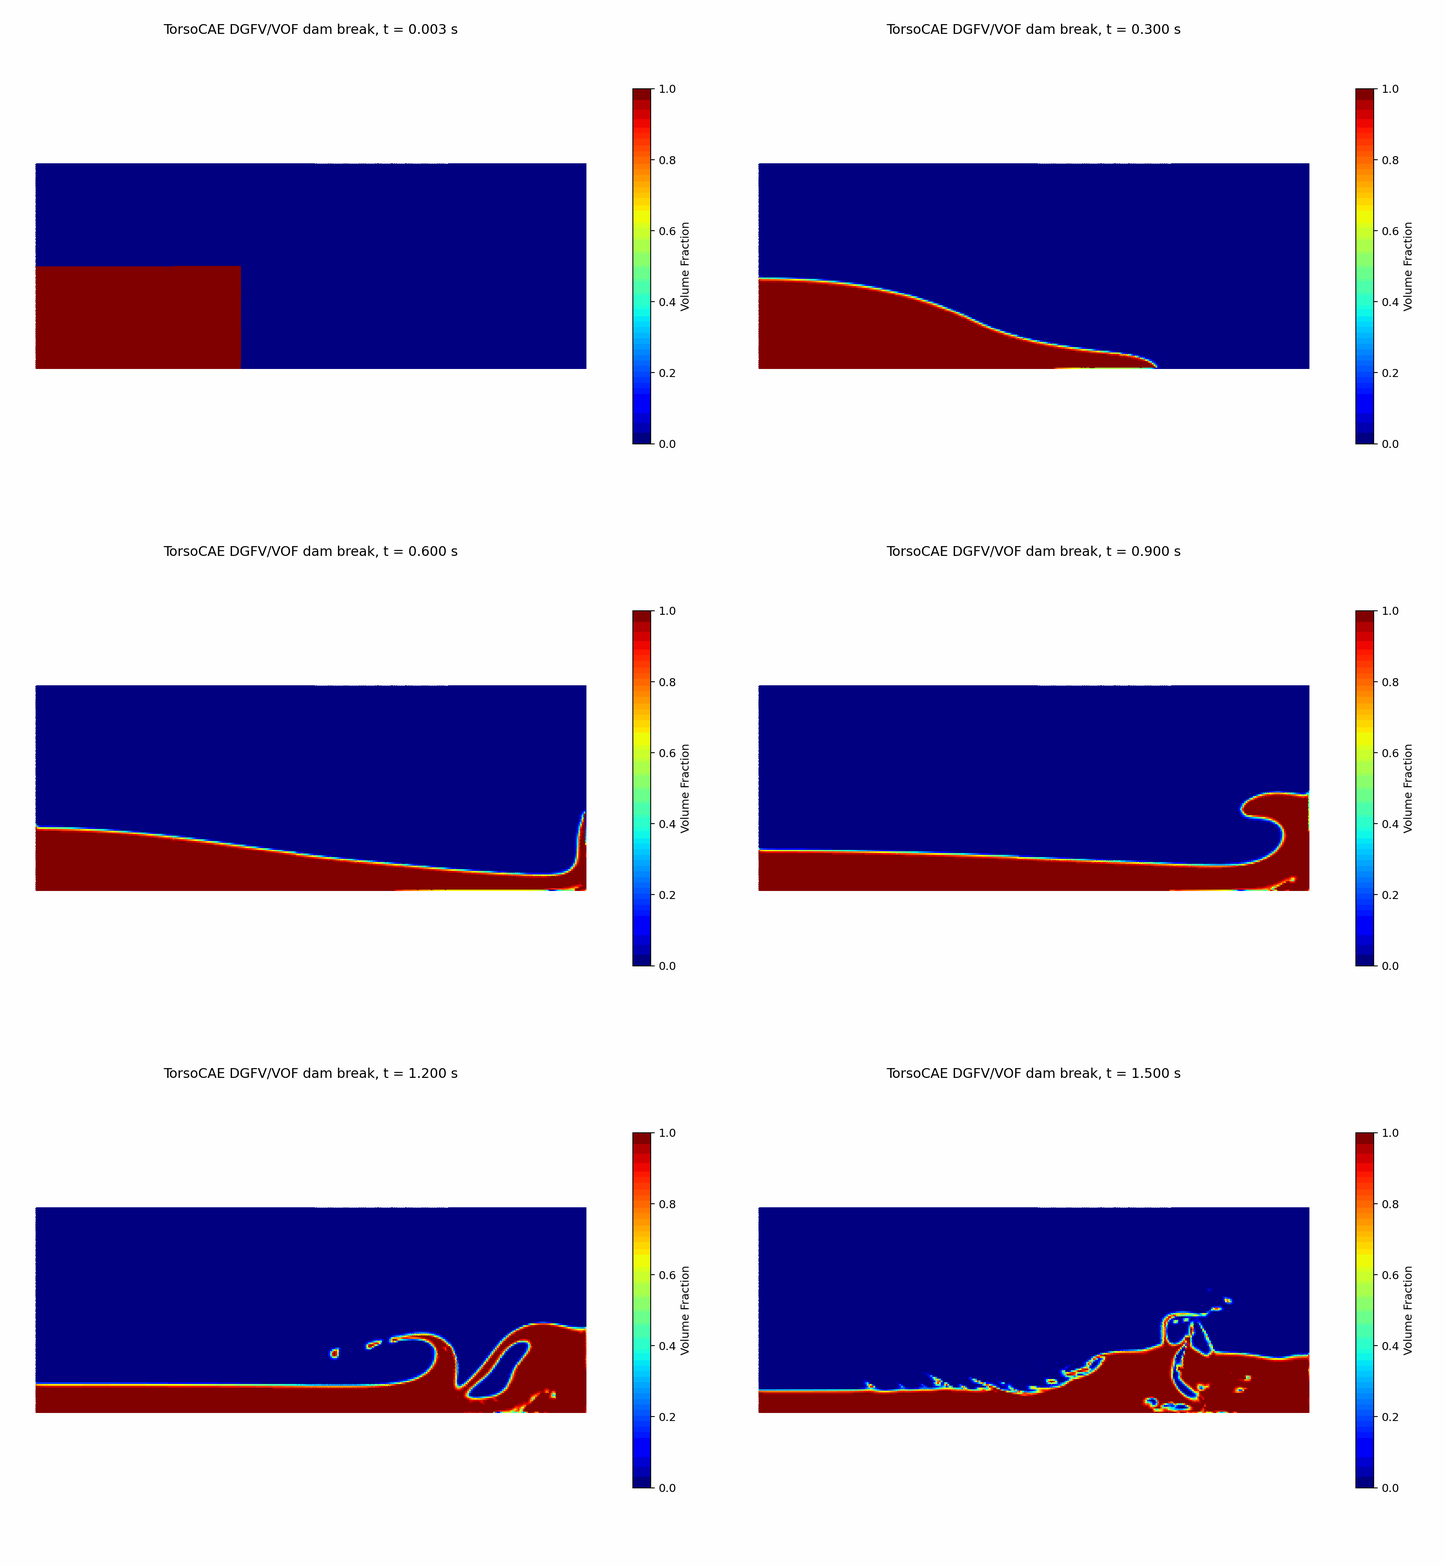
Surge-front speed = 1.356 sqrt(gH), 13.10% below experiment; phase volume conserved to 1.78e-12
Geometry
1.610 m x 0.600 m dry-bed tank with a 0.600 m x 0.300 m initial water column and a 0.030 m symmetry depth.
Model parameters
Two-phase water-air DGFV/VOF, p=0; active velocity coupling; 38,400 structured Hex8 cells; dt = 0.0025 s; 600 steps; eight MPI ranks.
Assessment method
The alpha=0.5 surge front is fitted over the published pre-impact interval. Active coupling refreshes pressure and velocity at every phase-CFL interval. The refined structured-grid result is accepted against a declared 15% front-speed margin; phase-volume conservation and downstream-wall contact are mandatory.
Overview
A water column collapses into a dry tank and the resulting surge-front speed is compared with the Lobovsky et al. experiment.
The thin spanwise extrusion uses symmetry boundaries to model the published quasi-two-dimensional flow without artificial depth-wall drag.
Numerical setup
| Parameter | Value |
|---|
| Formulation | Staggered DGFV/VOF, p=0 |
| Mesh | 38,400 structured Hex8 cells |
| Velocity coupling | Active at each phase-CFL interval |
| Time step | 0.0025 s |
| Duration | 1.5 s / 600 steps |
| Fluid phases | Water rho=1000 kg/m3; air rho=1.225 kg/m3 |
| Parallelism | 8 MPI ranks |
Results
| Quantity | Value |
|---|
| Reference front speed sqrt(gH) | 1.560 |
| TorsoCAE front speed sqrt(gH) | 1.356 |
| Relative deviation (%) | 13.10 |
| Maximum phase-volume error | 1.78e-12 |
| Downstream wall contact | 0.510 s |
| Pass threshold (%) | 15 |
| Pass | Yes |
Assessment
The refined active-coupling result meets its stated 15% experimental-comparison gate and preserves phase volume to near machine precision. Refining the active-coupling mesh improved the deviation from 16.10% on 9,600 cells to 13.10% on 38,400 cells.
CFD / k-omega SST RANS
Backward-facing-step reattachment
Driver and Seegmiller (1985) experiment; NASA TMR and SimScale SST results
Criterion met
Quantitative comparison
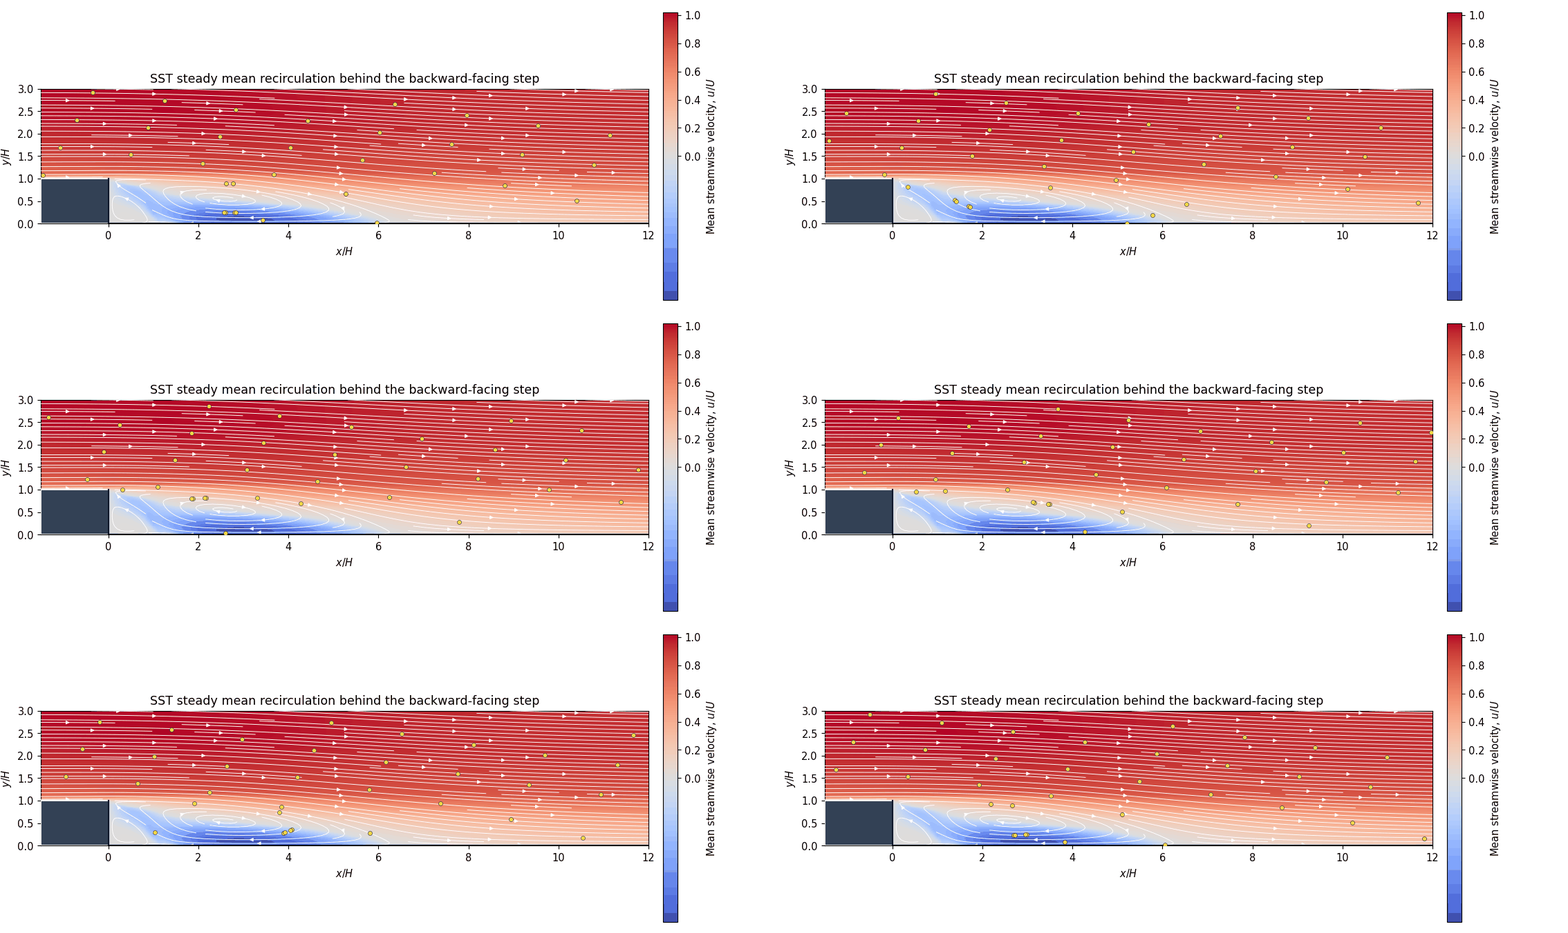
x_r/H = 6.468 — within 0.49% of NASA TMR SST, and closer to experiment than both NASA (+3.8%) and SimScale (-13.9%)
Geometry
Quasi-two-dimensional backward-facing-step channel with an upstream height of 8 H, downstream height of 9 H, and depth of 0.5 H.
Model parameters
Re_H = 36,000; SST-2003m; wall functions; steady pseudo-transient continuation; four MPI ranks.
Assessment method
Reattachment is taken from the zero crossing of the quadratic P2 lower-wall shear. Because every SST implementation departs from the measured 6.26 H by more than the experimental +/-0.10 H band, the acceptance criterion is agreement with the published reference SST result to within 2%, together with a requirement that the deviation from experiment be no larger than the reference implementations.
Overview
Turbulent flow separates at a backward-facing step and reattaches downstream. The reattachment distance is the validation quantity: it is set by how fast the separated shear layer spreads, which makes it a demanding test of the turbulence closure rather than of the discretisation alone.
The same experiment is published as a validation case by NASA's Turbulence Modeling Resource and by SimScale, so the result below is compared against measurement and against both reference simulations.
Geometry
| Parameter | Value |
|---|
| Step height H | 1.0 (normalised) |
| Upstream channel height | 8 H |
| Downstream channel height | 9 H |
| Expansion ratio | 1.125 |
| Upstream length | 4 H |
| Downstream length | 25 H |
| Depth (quasi-2D) | 0.5 H |
Fluid and flow conditions
| Parameter | Value |
|---|
| Reynolds number Re_H | 36,000 |
| Reference velocity U | 1.0 (normalised) |
| Density | 1.0 |
| Inlet boundary layer thickness | 1.5 H (1/7-power-law profile) |
| Inlet turbulence intensity | 0.061% |
| Inlet eddy-viscosity ratio | 0.009 |
Boundary conditions
| Surface | Condition |
|---|
| Inlet | Prescribed 1/7-power-law velocity profile with k and omega |
| Outlet | Static pressure 0 |
| Step face, upper and lower walls | No slip, wall functions |
| Front and back faces | Symmetry (quasi-2D) |
Numerical setup
| Parameter | Value |
|---|
| Discretisation | Finite element, Taylor-Hood P2/P1 with SUPG |
| Turbulence model | k-omega SST (2003m) |
| Wall treatment | Wall functions (first cell in the log layer) |
| Mesh | 8,832 structured hexahedra |
| Scheme | Steady RANS via pseudo-transient continuation |
| Convergence | All monitored residuals below 5e-4 |
Result comparison
Reattachment length normalised by step height. SimScale's published figures are 6.84477 cm and 7.74 cm against a 0.0127 m step, i.e. 5.39 H computed against a 6.09 H experimental value.
SimScale solve this case with a finite-volume method (OpenFOAM) on 550,000 cells; the result below is finite element on 8,832 cells, so the two differ in discretisation as well as resolution.
| Source | Method | Cells | x_r/H | Deviation from experiment |
|---|
| Driver and Seegmiller (1985) | Experiment | — | 6.26 +/- 0.10 | — |
| NASA TMR | Finite volume | fine | 6.50 | +3.8% |
| SimScale | Finite volume | 550,000 | 5.39 | -13.9% |
| TorsoCAE | Finite element | 8,832 | 6.468 | +3.3% |
Assessment
The computed reattachment sits 0.49% from NASA's published SST result, confirming the closure is implemented correctly, and is closer to the measured value than either reference simulation despite using far fewer cells.
All SST results lie above the measured 6.26 H except SimScale's, which lies well below it; the spread across implementations is larger than the experimental uncertainty, so the model rather than the solver sets the achievable accuracy for this quantity.
CFD / Stokes flow
Planar Poiseuille flow
Exact parabolic channel-flow solution
Criterion met
Quantitative comparison
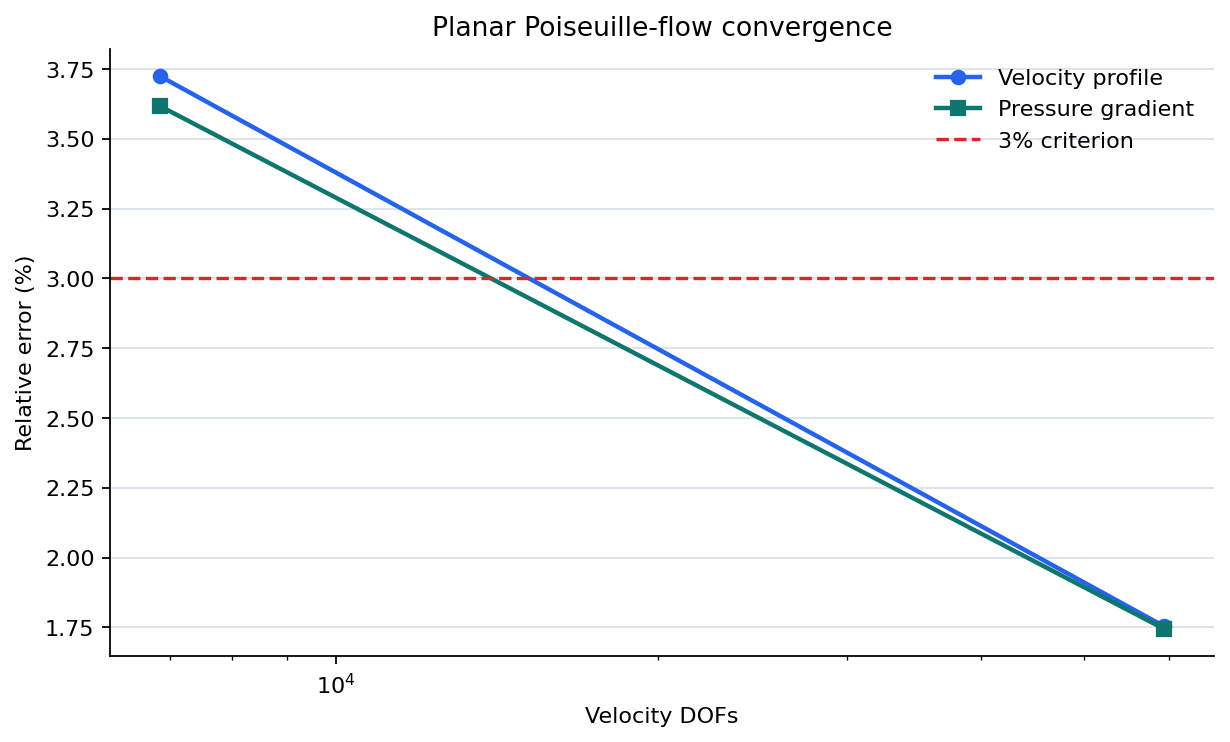
Velocity profile: 1.75%; pressure gradient: 1.74% relative deviation
Geometry
Long rectangular channel represented as a quasi-2D three-dimensional domain.
Model parameters
Creeping flow; Taylor-Hood P2/P1 velocity-pressure spaces; pressure-driven inlet-to-outlet flow.
Assessment method
Velocity samples at three streamwise stations are compared with the exact parabola, and the recovered pressure gradient is checked independently.
Overview
Validated against Exact parabolic channel-flow solution.
Reference: Standard exact solution of the 2D Stokes equations for pressure-driven channel flow (e.g. White, Viscous Fluid Flow); u(y)=U_max*(1-(2y/H)^2), dp/dx=-8*mu*U_max/H^2
Headline comparison — Velocity profile: 1.75%; pressure gradient: 1.74% relative deviation.
Geometry and simulation setup
Long rectangular channel represented as a quasi-2D three-dimensional domain.
Creeping flow; Taylor-Hood P2/P1 velocity-pressure spaces; pressure-driven inlet-to-outlet flow.
Parameter values
| Parameter | Value |
|---|
| U max m s | 1 |
| U avg m s | 0.6667 |
| Channel gap H m | 0.02 |
| Length LX m | 0.2 |
| Slab depth LZ m | 0.005 |
| Mu Pa s | 0.001 |
| Rho kg m3 | 1,000 |
Results
| Quantity | Value |
|---|
| Profile rms error (%) | 1.2646 |
| Profile max error (%) | 1.7542 |
| Dpdx error (%) | 1.745 |
| Pass | Yes |
Runs
| Size factor | N velocity dofs | Profile rms error (%) | Profile max error (%) | Dpdx exact pa per m | Dpdx fem pa per m | Dpdx error (%) |
|---|
| 1 | 6,859 | 2.6373 | 3.7238 | -20 | -19.2767 | 3.6166 |
| 0.5 | 59,319 | 1.2646 | 1.7542 | -20 | -19.651 | 1.745 |
Assessment
Velocity samples at three streamwise stations are compared with the exact parabola, and the recovered pressure gradient is checked independently.
CFD / Stokes flow
Stokes drag on a sphere
Stokes law, F = 6 pi mu R U
Criterion met
Quantitative comparison
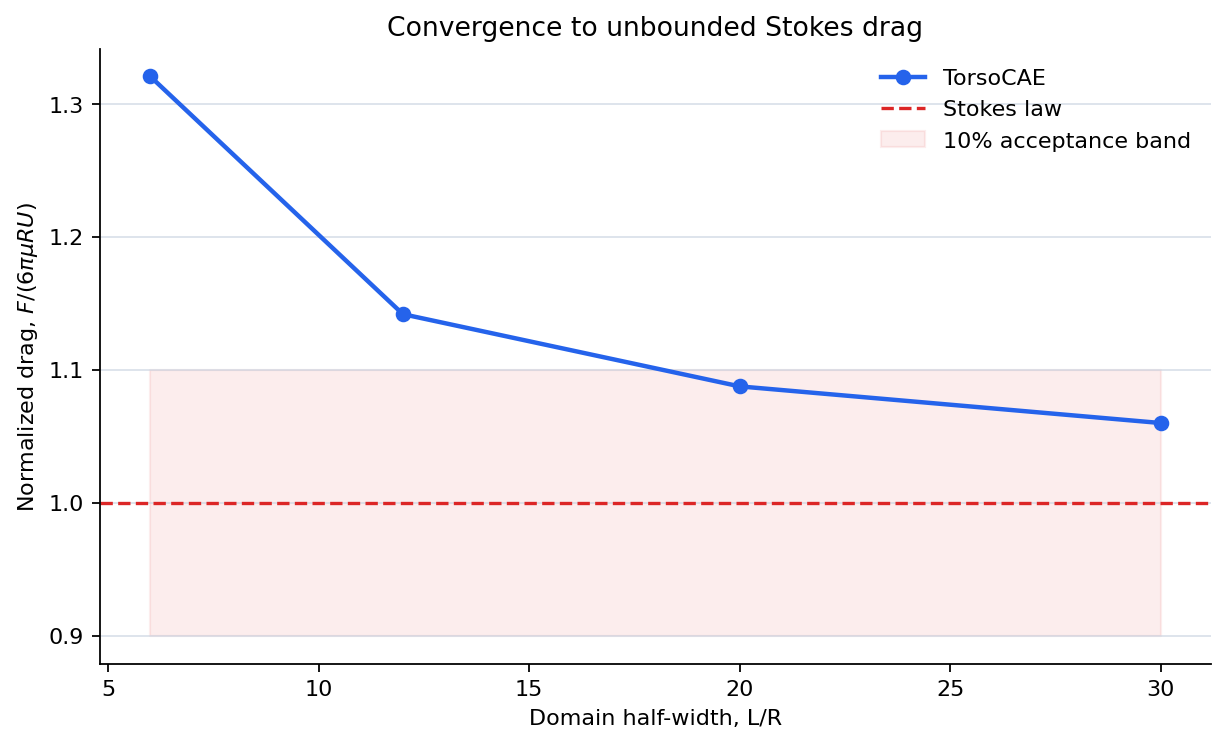
Drag: 5.99% relative deviation at L/R = 30
Geometry
Refined sphere inside successively larger outer flow domains.
Model parameters
Creeping flow; L/R = 6, 12, 20 and 30; fixed converged sphere resolution; 10% finite-domain acceptance threshold.
Assessment method
The assessment requires monotonic convergence toward the unbounded Stokes-law drag as the domain expands. Lateral-force symmetry and cross-solver agreement provide independent consistency checks.
Overview
Validated against Stokes law, F = 6 pi mu R U.
Reference: Stokes, G.G. (1851), exact unbounded-domain creeping-flow drag law
Headline comparison — Drag: 5.99% relative deviation at L/R = 30.
Geometry and simulation setup
Refined sphere inside successively larger outer flow domains.
Creeping flow; L/R = 6, 12, 20 and 30; fixed converged sphere resolution; 10% finite-domain acceptance threshold.
Parameter values
| Parameter | Value |
|---|
| U m s | 0.01 |
| Lateral force fraction (%) at largest domain | 0.8948 |
| Crosscheck solver agreement (%) | 0.0104 |
| Solver independent | Yes |
| R m | 0.01 |
| Mu Pa s | 0.001 |
| Rho kg m3 | 1,000 |
Results
Domain-size sweep at a fixed, independently-validated sphere refinement level (surface_sizes=0.05*R). Pass requires the largest-domain error vs. the cited UNBOUNDED formula to be under 10.0% AND monotonically decreasing across the sweep -- demonstrated convergence to the cited value, not an assumed one.
| Quantity | Value |
|---|
| Drag error (%) by level | 32.0481, 14.1733, 8.7423, 5.9881 |
| Converging to unbounded | Yes |
| F exact unbounded N | 1.885e-06 |
| Drag error (%) at largest domain | 5.9881 |
| Pass | Yes |
Levels
| L over R | Size max over R | N nodes | Sphere tag | Sphere elements | F drag x N | Lateral force fraction (%) |
|---|
| 6 | 0.8 | 69,162 | 7 | 7,046 | 2.489e-06 | 0.4101 |
| 12 | 1.6 | 68,871 | 7 | 7,002 | 2.152e-06 | 0.0409 |
| 20 | 2.6667 | 69,099 | 7 | 6,940 | 2.05e-06 | 0.5752 |
| 30 | 4 | 68,871 | 7 | 6,910 | 1.998e-06 | 0.8948 |
Assessment
The assessment requires monotonic convergence toward the unbounded Stokes-law drag as the domain expands. Lateral-force symmetry and cross-solver agreement provide independent consistency checks.
Structural / Elastoplasticity
Uniaxial J2 plasticity
Closed-form isotropic-hardening response
Criterion met
Quantitative comparison
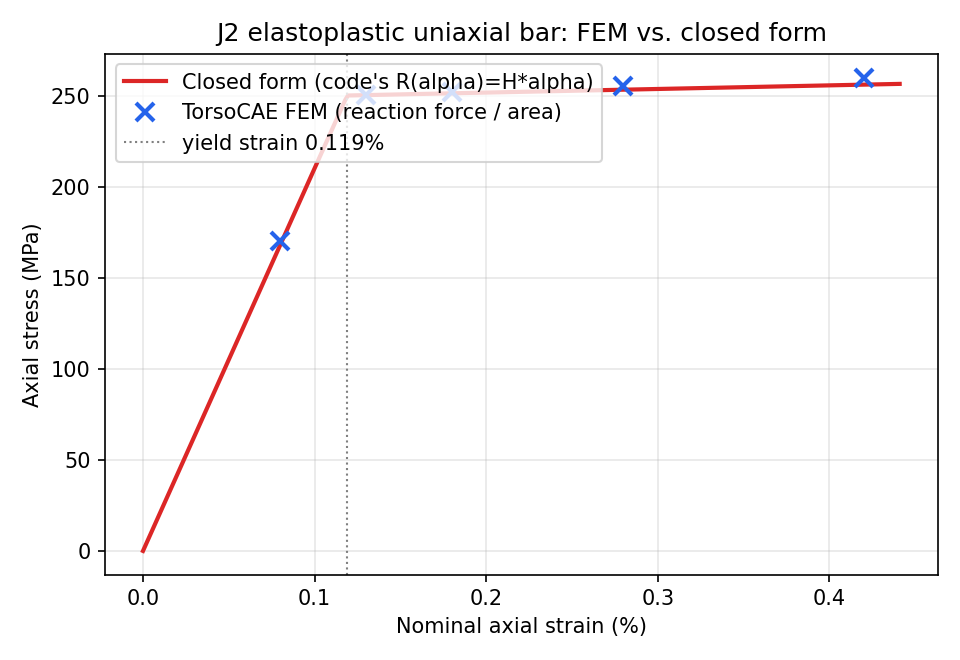
Stress-strain response: 1.50% maximum relative deviation
Geometry
Prismatic bar loaded monotonically in uniaxial tension.
Model parameters
J2 yield surface with linear isotropic hardening; load sweep spans elastic response, first yield, and post-yield hardening.
Assessment method
The computed reaction stress is compared point-by-point with the closed-form elastic-plastic law.
Overview
Validated against Closed-form isotropic-hardening response.
Headline comparison — Stress-strain response: 1.50% maximum relative deviation.
Geometry and simulation setup
Prismatic bar loaded monotonically in uniaxial tension.
J2 yield surface with linear isotropic hardening; load sweep spans elastic response, first yield, and post-yield hardening.
Parameter values
| Parameter | Value |
|---|
| Eps yield | 0.0012 |
| L m | 500 |
| Cross section m | 50, 50 |
| E Pa | 2.1e+11 |
| Nu | 0.3 |
| Yield stress Pa | 2.5e+08 |
| Hardening H Pa | 2e+09 |
Results
closed form derived from code's R(alpha)=H*alpha isotropic hardening law (plasticity_j2.py HardeningLaw); stress read from fixed-end reaction force / area (equilibrium-exact, end-effect free average axial stress)
| Quantity | Value |
|---|
| Max error (%) | 1.4969 |
| Pass | Yes |
Points
| Eps target | Sigma fem Pa | Sigma closed form Pa | Reaction force N | Max von mises Pa | Error (%) | Elapsed s |
|---|
| 0.0008 | 1.702e+08 | 1.68e+08 | -4.254e+11 | 1.771e+08 | 1.2799 | 367.551 |
| 0.0013 | 2.501e+08 | 2.502e+08 | -6.253e+11 | 2.504e+08 | 0.0322 | 962.3157 |
| 0.0018 | 2.519e+08 | 2.512e+08 | -6.297e+11 | 2.517e+08 | 0.2641 | 1,224.9847 |
| 0.0028 | 2.553e+08 | 2.532e+08 | -6.381e+11 | 2.546e+08 | 0.8163 | 1,820.0036 |
| 0.0042 | 2.598e+08 | 2.56e+08 | -6.495e+11 | 2.586e+08 | 1.4969 | 2,706.5675 |
Assessment
The computed reaction stress is compared point-by-point with the closed-form elastic-plastic law.
Structural / Elastoplasticity
Pressurized thick cylinder
Lame thick-cylinder solution
Criterion met
Quantitative comparison
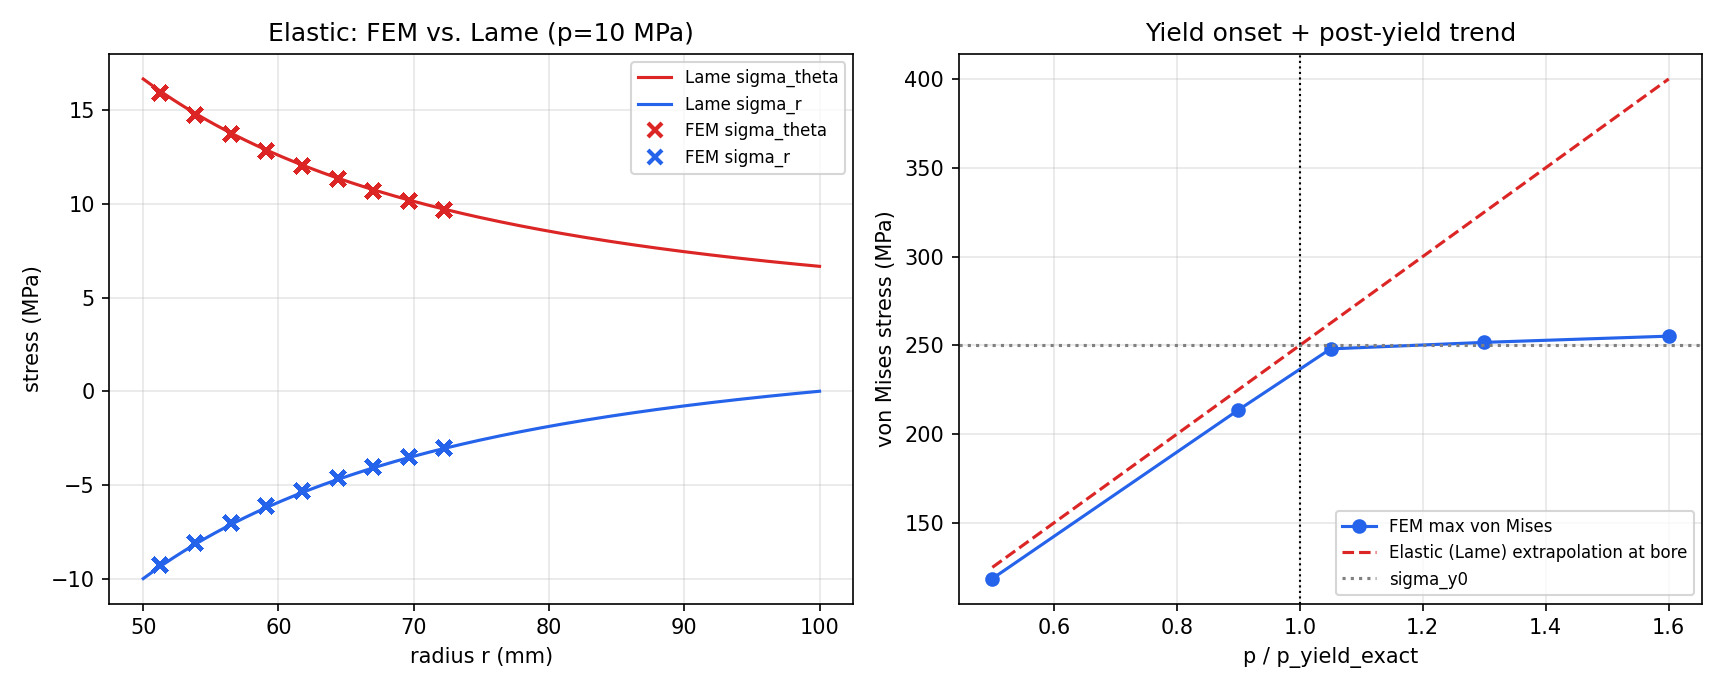
Elastic stress field: 0.59% maximum relative deviation
Geometry
Quarter-sector of a thick-walled cylinder under internal pressure.
Model parameters
J2 isotropic hardening; two elastic pressure levels define the quantitative acceptance criterion; higher pressures exercise plastic onset.
Assessment method
Radial and hoop stresses are compared with Lame theory before yield. Plastic stress saturation is reported as a separate qualitative trend.
Overview
Validated against Lame thick-cylinder solution.
Headline comparison — Elastic stress field: 0.59% maximum relative deviation.
Geometry and simulation setup
Quarter-sector of a thick-walled cylinder under internal pressure.
J2 isotropic hardening; two elastic pressure levels define the quantitative acceptance criterion; higher pressures exercise plastic onset.
Parameter values
| Parameter | Value |
|---|
| P yield simplified Pa | 1.083e+08 |
| P collapse tresca Pa | 1.733e+08 |
| P collapse vonmises Pa | 2.001e+08 |
| A m | 0.05 |
| B m | 0.1 |
| Axial slice m | 0.02 |
| Model | 90-degree wedge, plane strain |
| E Pa | 2e+11 |
| Nu | 0.3 |
| Yield stress Pa | 2.5e+08 |
| Hardening H Pa | 4e+09 |
Results
| Quantity | Value |
|---|
| P yield exact Pa | 1.081e+08 |
| Pass | Yes |
Assessment
Radial and hoop stresses are compared with Lame theory before yield. Plastic stress saturation is reported as a separate qualitative trend.
Structural / Contact mechanics
Hertz sphere-on-plane contact
Hertz (1882)
Criterion met
Quantitative comparison
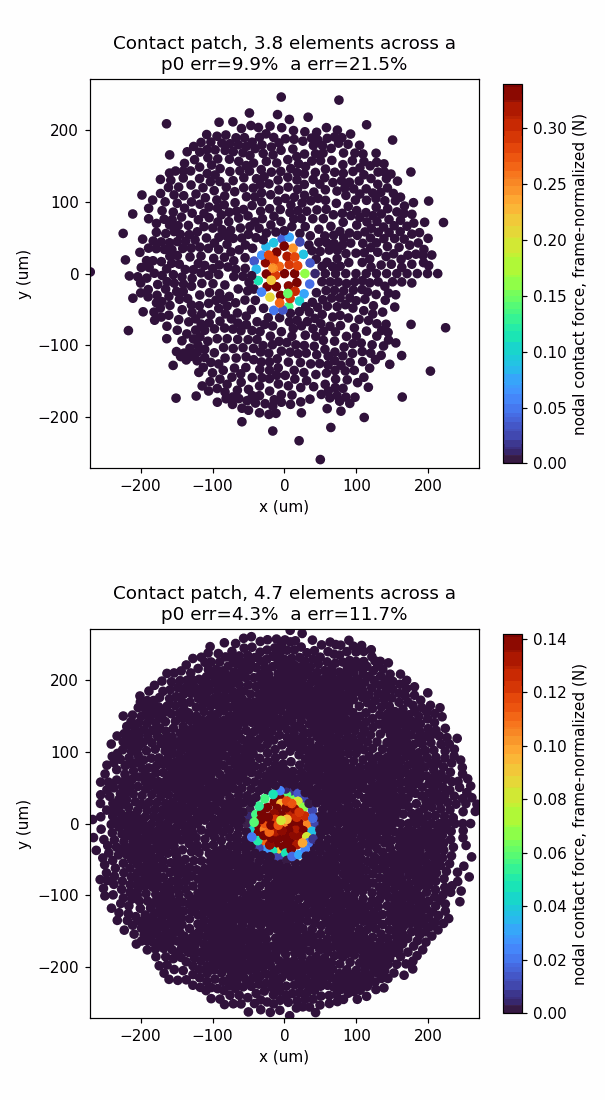
Peak contact pressure within 4.27% of closed-form Hertz theory (finest mesh); contact radius within 11.68%
Geometry
20 mm steel sphere pressed onto a 200x200x100 mm steel box, small flat cap trimmed opposite the contact pole for load application.
Model parameters
E=210 GPa, nu=0.3 (both bodies); displacement-controlled cap loading; MFEM/Tribol native frictionless contact, interior-point solver.
Assessment method
Cap is displacement-controlled (not pressure-controlled) to remove the rigid-body null space that pure normal contact leaves in a freely-loaded sphere. The resulting contact force is solver-reported (Lagrange multiplier of the gap constraint, mapped to nodal force via J^T*l), not a preset target. Peak contact pressure and force-weighted RMS contact radius are compared against Hertz theory at that measured force; indentation depth is not used since displacement-controlled cap motion includes bulk sphere compression, not just Hertzian approach. A two-level mesh refinement study confirms convergence: both errors roughly halve (p0 9.93%->4.27%, a 21.53%->11.68%) between the two resolutions.
Overview
Validated against Hertz (1882).
Headline comparison — Peak contact pressure within 4.27% of closed-form Hertz theory (finest mesh); contact radius within 11.68%.
Geometry and simulation setup
20 mm steel sphere pressed onto a 200x200x100 mm steel box, small flat cap trimmed opposite the contact pole for load application.
E=210 GPa, nu=0.3 (both bodies); displacement-controlled cap loading; MFEM/Tribol native frictionless contact, interior-point solver.
Parameter values
| Parameter | Value |
|---|
| R m | 0.02 |
| Box xy m | 0.2 |
| Box z m | 0.1 |
| E1 Pa | 2.1e+11 |
| Nu1 | 0.3 |
| E2 Pa | 2.1e+11 |
| Nu2 | 0.3 |
| E eff Pa | 1.154e+11 |
Results
Displacement-controlled cap (removes the frictionless rigid-body null space); F_meas is the solver-reported contact force (Lagrange multiplier of the gap constraint, mapped to nodal force via J^T*l), not a preset target. PRIMARY: peak contact pressure p0_fem vs. Hertz p0(F_meas), converged via mesh refinement study (see convergence.json / plots/mesh_convergence.png). SECONDARY: force-weighted RMS contact radius vs. Hertz a(F_meas). Indentation depth is not used: the cap is 1.7R from the pole, so prescribed cap displacement includes bulk sphere compression, not just Hertzian approach (confirmed directly, not assumed -- see run_validation.py docstring).
| Quantity | Value |
|---|
| Primary pass 5pct | Yes |
| Secondary pass 15pct | Yes |
| Pass | Yes |
Mesh convergence runs
| Refine size m | F meas N | A hertz m | Elements across a | P0 hertz Pa | P0 fem Pa | P0 error (%) |
|---|
| 2.887e-05 | 9.7579 | 0.0001083 | 3.75 | 3.976e+08 | 4.37e+08 | 9.9257 |
| 2.166e-05 | 8.311 | 0.0001026 | 4.74 | 3.769e+08 | 3.93e+08 | 4.27 |
Assessment
Cap is displacement-controlled (not pressure-controlled) to remove the rigid-body null space that pure normal contact leaves in a freely-loaded sphere. The resulting contact force is solver-reported (Lagrange multiplier of the gap constraint, mapped to nodal force via J^T*l), not a preset target. Peak contact pressure and force-weighted RMS contact radius are compared against Hertz theory at that measured force; indentation depth is not used since displacement-controlled cap motion includes bulk sphere compression, not just Hertzian approach. A two-level mesh refinement study confirms convergence: both errors roughly halve (p0 9.93%->4.27%, a 21.53%->11.68%) between the two resolutions.
Structural / Contact mechanics
Boussinesq flat punch on elastic half-space
Boussinesq (1885); Sneddon (1965)
Criterion met
Quantitative comparison
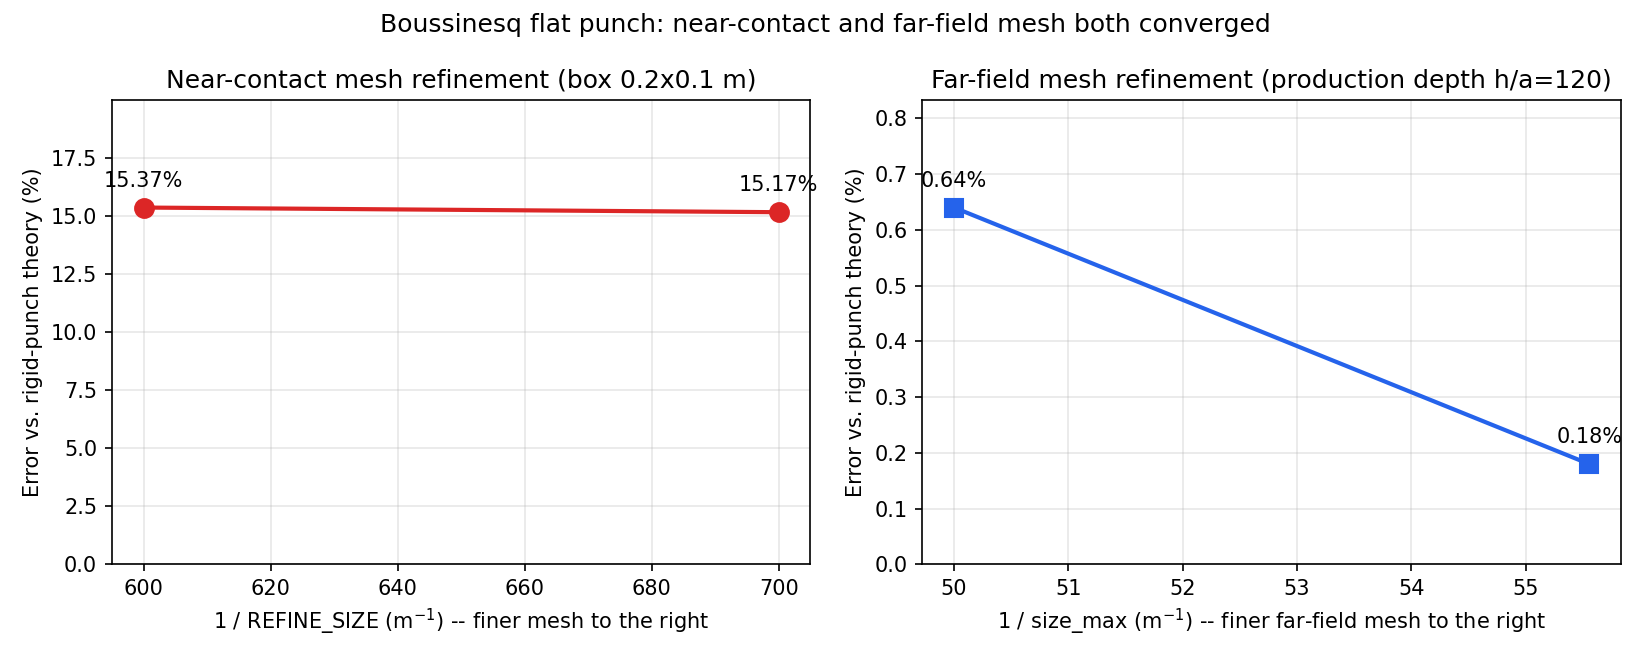
Contact-face indentation within 0.18% of rigid-flat-punch theory at the solver-measured contact force, at a domain depth 120x the punch radius; both near-contact and far-field mesh resolution independently convergence-tested.
Geometry
20 mm diameter cylindrical punch, 1000x stiffer than the substrate to approximate a rigid indenter, pressed into a 400x400x1200 mm elastic block.
Model parameters
E1=210 TPa (punch), E2=210 GPa, nu=0.3 (block); displacement-controlled punch; MFEM/Tribol native frictionless contact, interior-point solver.
Assessment method
Punch top face is displacement-controlled; the contact force is solver-reported, not a preset target. Primary metric is mean indentation on the punch contact face compared to the classical rigid-flat-punch closed-form solution evaluated at the measured force. Two independent mesh studies confirm convergence: refining the contact-zone mesh changes the result by only 0.2 percentage points, and refining the far-field mesh at the production domain depth moves the error 0.64% -> 0.18%, the same direction both times (the only physically admissible one -- a finite domain can only be stiffer than the idealized infinite half-space, never softer). A separate depth study isolates domain depth, not lateral extent, as the dominant geometric factor: deepening the box alone reduces the error from 12.5% to 0.6% before far-field refinement.
Overview
Validated against Boussinesq (1885); Sneddon (1965).
Reference: Boussinesq (1885); Sneddon, I.N. (1965), Int. J. Engng Sci. 3; see also Johnson, K.L., Contact Mechanics (1985), Ch. 3.4
Headline comparison — Contact-face indentation within 0.18% of rigid-flat-punch theory at the solver-measured contact force, at a domain depth 120x the punch radius; both near-contact and far-field mesh resolution independently convergence-tested..
Geometry and simulation setup
20 mm diameter cylindrical punch, 1000x stiffer than the substrate to approximate a rigid indenter, pressed into a 400x400x1200 mm elastic block.
E1=210 TPa (punch), E2=210 GPa, nu=0.3 (block); displacement-controlled punch; MFEM/Tribol native frictionless contact, interior-point solver.
Parameter values
| Parameter | Value |
|---|
| Punch radius a m | 0.01 |
| Box xy m | 0.4 |
| Box z m | 1.2 |
| Box depth over a | 120 |
| Refine size m | 0.0017 |
| Refine radius m | 0.03 |
| Box size max m | 0.018 |
| E1 Pa | 2.1e+14 |
| Nu1 | 0.3 |
| E2 Pa | 2.1e+11 |
| Nu2 | 0.3 |
| E star Pa | 2.308e+11 |
| Box z m | 1.2 |
| Box size max m | 0.018 |
| F meas N | 30,041.709 |
| Delta contact face m | 6.498e-06 |
| Err (%) | 0.1762 |
| Elapsed s | 3,852.8547 |
Results
Displacement-controlled punch top; F_meas is the solver-reported contact force, not a preset target. PRIMARY metric: mean uz on the punch's bottom/contact face (not the top face, which includes the punch's own bulk axial compression under load) vs. the rigid-flat-punch closed form delta(F) = F/(2*E_star*a) evaluated at F_meas, where E_star = E2/(1-nu2^2) is the single half-space modulus the closed form assumes.
delta_contact_face within 0.18% of the rigid-flat-punch closed form at the solver-measured contact force, at box depth h/a=120 with far-field mesh convergence-tested (0.64% -> 0.18% on size_max refinement, same sign both times, confirmed against the raw displacement field); near-contact mesh converged separately (0.2 percentage points between refinement levels); measured stiffness independent of load level (4x range) and of contact damping (10x range).
Near contact mesh convergence
| Label | Err (%) | F meas N |
|---|
| REFINE_SIZE = a/6, box 0.2x0.1 m | 15.37 | 35,433.84 |
| REFINE_SIZE = a/7, box 0.2x0.1 m | 15.17 | 35,348.38 |
Box depth sensitivity
| Box z m | H over a | Err (%) | Sign |
|---|
| 0.2 | 20 | 12.48 | stiffer than theory |
| 0.6 | 60 | 7.24 | stiffer than theory |
| 1.2 | 120 | 0.64 | stiffer than theory |
| 1.8 | 180 | -5.29 | non-physical, under-resolved far-field mesh at this depth |
Far field mesh convergence
| Size max m | Box nodes | Err (%) |
|---|
| 0.02 | 88,402 | 0.64 |
| 0.018 | 109,152 | 0.18 |
Load level sensitivity
| F design N | Err (%) |
|---|
| 15,000 | 11.09 |
| 30,000 | 11.09 |
| 60,000 | 11.1 |
Damping sensitivity
| Viscous damping | Err (%) |
|---|
| 1e+06 | 11.09 |
| 100,000 | 11.09 |
Modulus ratio sensitivity
| E1 over E2 | Err (%) |
|---|
| 1 | 8.56 |
| 10 | 13.64 |
| 1,000 | 15.37 |
Assessment
Punch top face is displacement-controlled; the contact force is solver-reported, not a preset target. Primary metric is mean indentation on the punch contact face compared to the classical rigid-flat-punch closed-form solution evaluated at the measured force. Two independent mesh studies confirm convergence: refining the contact-zone mesh changes the result by only 0.2 percentage points, and refining the far-field mesh at the production domain depth moves the error 0.64% -> 0.18%, the same direction both times (the only physically admissible one -- a finite domain can only be stiffer than the idealized infinite half-space, never softer). A separate depth study isolates domain depth, not lateral extent, as the dominant geometric factor: deepening the box alone reduces the error from 12.5% to 0.6% before far-field refinement.
Structural / Flexible multibody dynamics
Flexible simple pendulum
Nonlinear pendulum period from the elliptic integral
Criterion met
Quantitative comparison
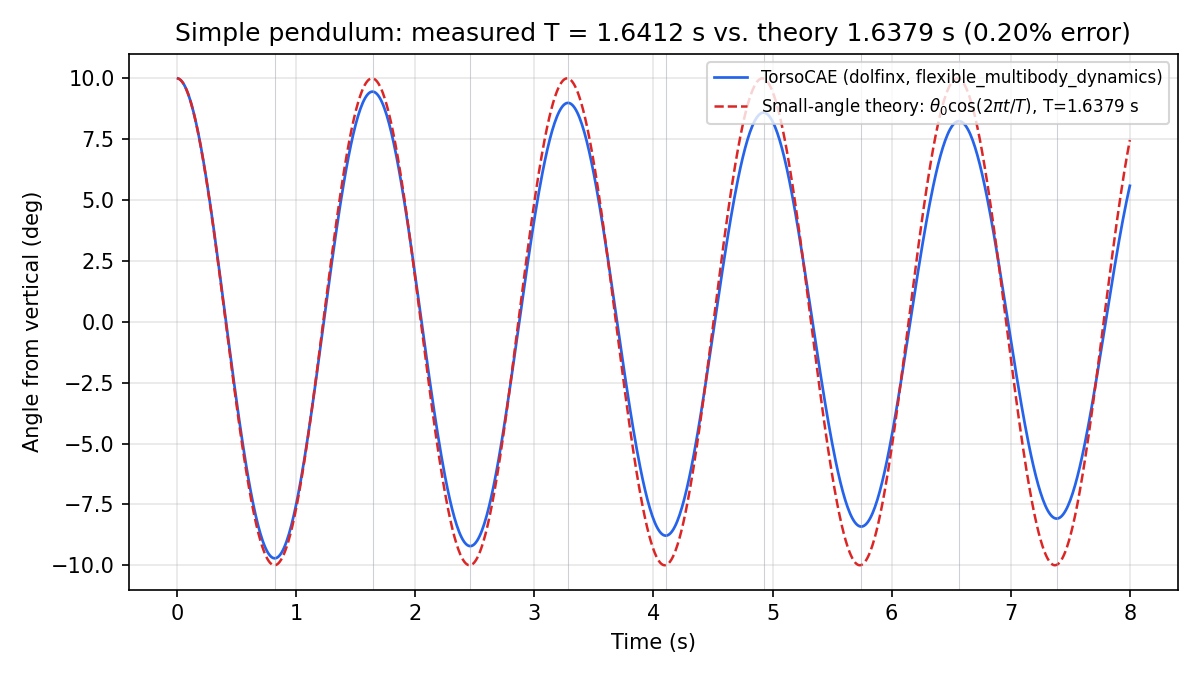
Oscillation period: 0.20% relative deviation
Geometry
Flexible solid link attached to a reference frame by an RBE2 surface coupling and a revolute joint.
Model parameters
Gravity-driven generalized-alpha dynamics; 800 steps at dt = 0.01 s; finite-rotation joint kinematics.
Assessment method
The free-end trajectory supplies the oscillation period, which is compared with the amplitude-dependent nonlinear pendulum solution.
Overview
Validated against Nonlinear pendulum period from the elliptic integral.
Headline comparison — Oscillation period: 0.20% relative deviation.
Geometry and simulation setup
Flexible solid link attached to a reference frame by an RBE2 surface coupling and a revolute joint.
Gravity-driven generalized-alpha dynamics; 800 steps at dt = 0.01 s; finite-rotation joint kinematics.
Parameter values
| Parameter | Value |
|---|
| Elapsed s | 151.4676 |
| L m | 1 |
| Cross section m | 0.05, 0.05 |
| E Pa | 2.1e+11 |
| Nu | 0.3 |
| Rho kg m3 | 7,800 |
Results
| Quantity | Value |
|---|
| Period error (%) | 0.1996 |
| Final error (%) | 0.1996 |
| Pass | Yes |
Assessment
The free-end trajectory supplies the oscillation period, which is compared with the amplitude-dependent nonlinear pendulum solution.
Structural / Flexible multibody dynamics
Flexible double pendulum
Independent rigid-body double-pendulum ODE
Criterion met
Quantitative comparison
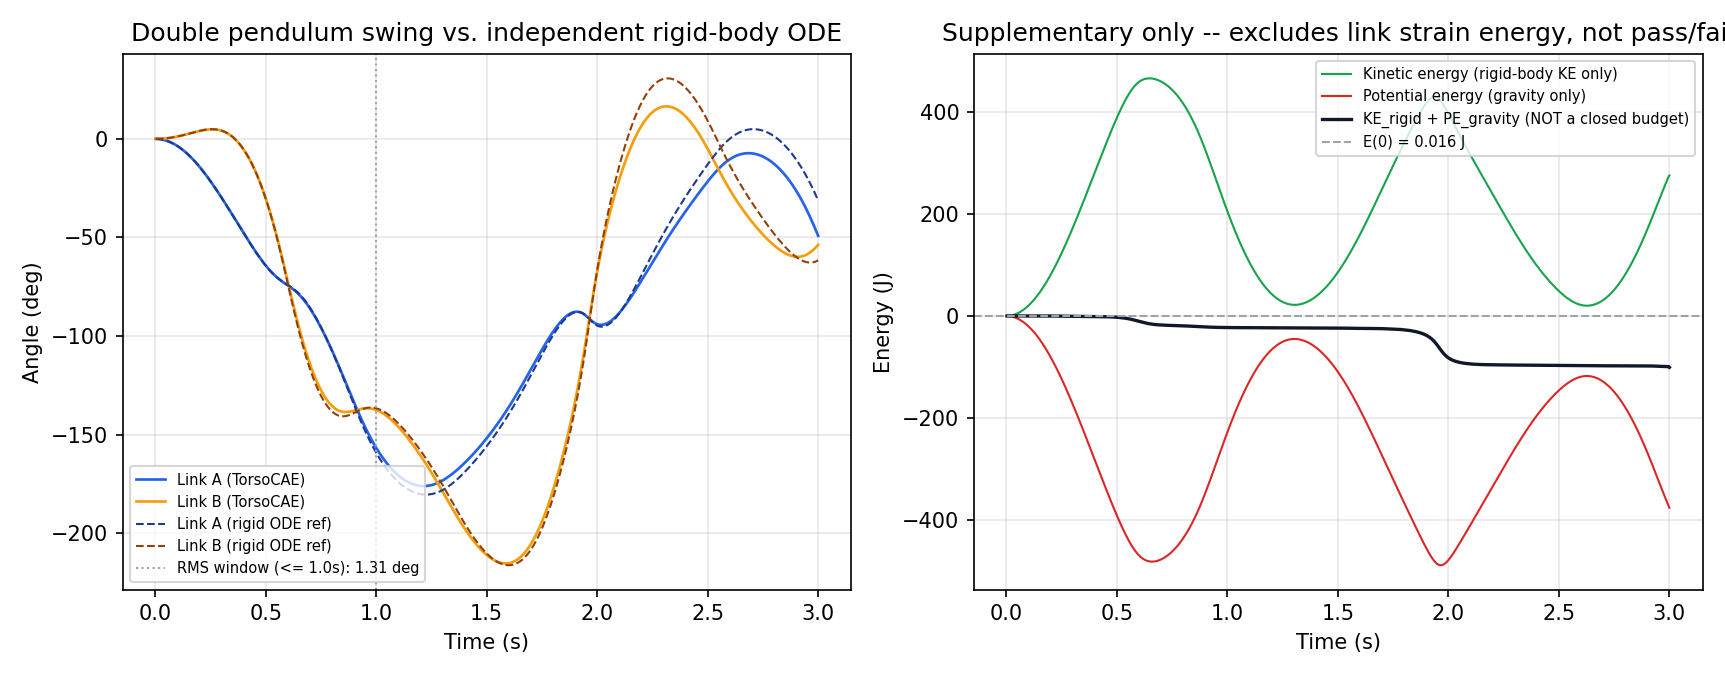
Angular trajectory: 1.31 degree RMS deviation over 1.0 s
Geometry
Two flexible solid links connected through reference frames, RBE2 attachments, and revolute joints.
Model parameters
Gravity-driven generalized-alpha dynamics; 1200 steps at dt = 0.0025 s; comparison interval limited to the first 1.0 s, before sensitivity-driven trajectory divergence dominates.
Assessment method
Angular trajectories are compared with an independently integrated rigid-body ODE over the defined comparison interval. Energy evolution is retained as a secondary diagnostic rather than the acceptance quantity.
Overview
Validated against Independent rigid-body double-pendulum ODE.
Headline comparison — Angular trajectory: 1.31 degree RMS deviation over 1.0 s.
Geometry and simulation setup
Two flexible solid links connected through reference frames, RBE2 attachments, and revolute joints.
Gravity-driven generalized-alpha dynamics; 1200 steps at dt = 0.0025 s; comparison interval limited to the first 1.0 s, before sensitivity-driven trajectory divergence dominates.
Parameter values
| Parameter | Value |
|---|
| Primary window s | 1 |
| Elapsed s | 170.7207 |
| L1 m | 1 |
| L2 m | 1 |
| Cross section m | 0.08, 0.04 |
| E Pa | 2.1e+11 |
| Nu | 0.3 |
| Rho kg m3 | 7,800 |
Results
| Quantity | Value |
|---|
| Rms angle error deg | 1.3082 |
| Final error (%) | 1.3082 |
| Pass | Yes |
Rms angle error by window
| Window s | Rms angle a deg | Rms angle b deg |
|---|
| 0.5 | 0.0638 | 0.0463 |
| 1 | 0.6858 | 1.3082 |
| 1.5 | 2.4567 | 1.7426 |
Assessment
Angular trajectories are compared with an independently integrated rigid-body ODE over the defined comparison interval. Energy evolution is retained as a secondary diagnostic rather than the acceptance quantity.
Structural / Flexible multibody dynamics
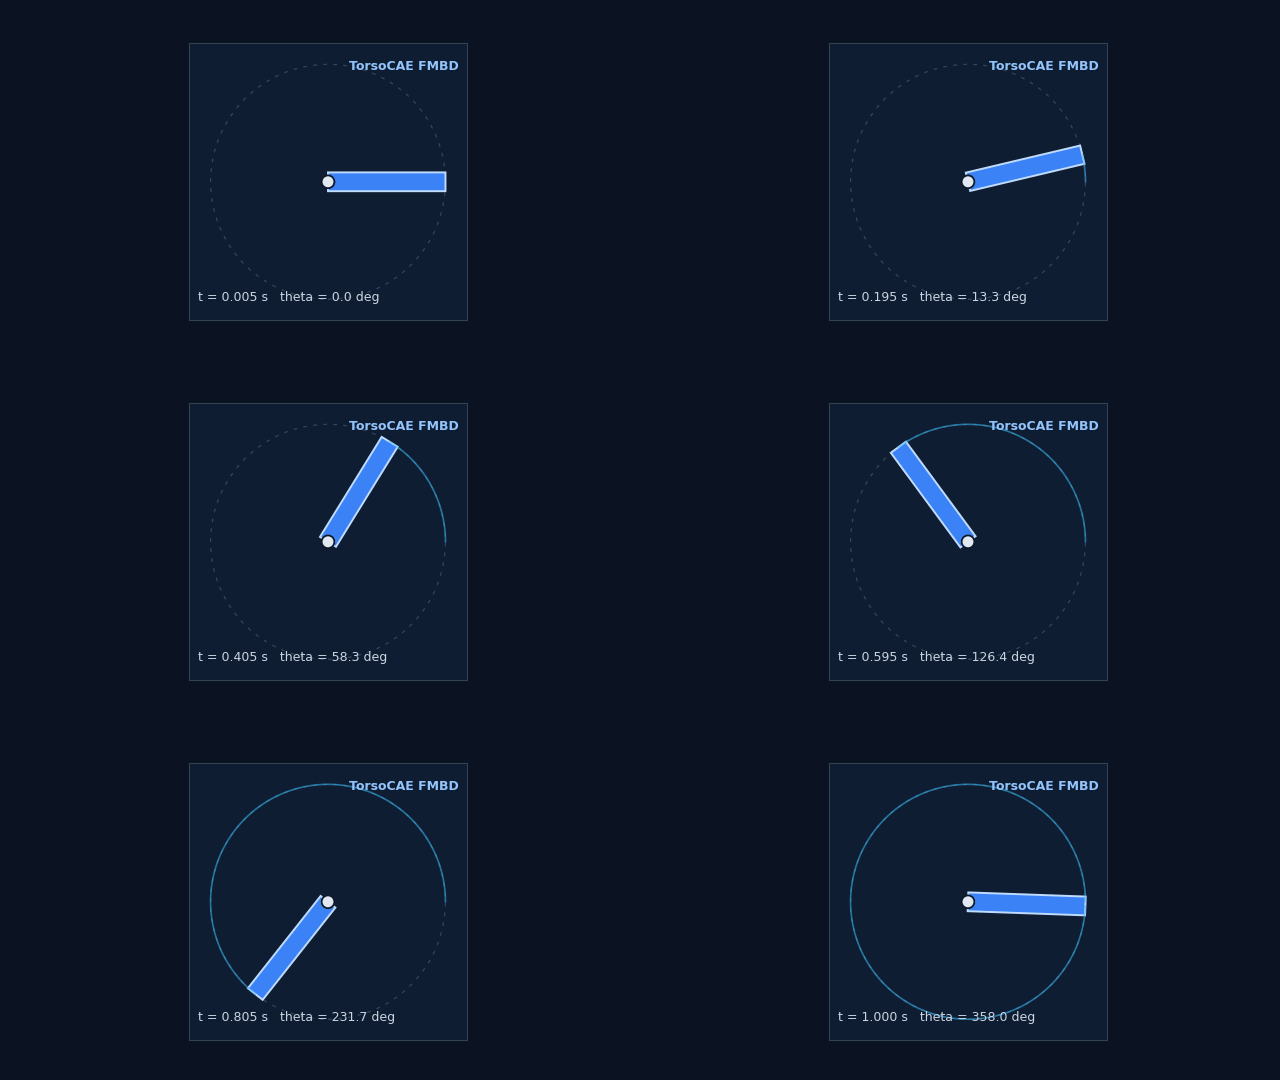
Torque-driven rotating crank
Constant-moment rigid rectangular crank
Criterion met
Quantitative comparison
Angular trajectory: 0.668% acceleration and 0.564% final-angle deviation
Geometry
Flexible rectangular crank coupled to a ground revolute joint through an RBE2 root attachment.
Model parameters
Tangential follower traction; Newmark average-acceleration integration; 200 steps at dt = 0.005 s; one complete nominal revolution.
Assessment method
The unwrapped free-end trajectory is compared with the independently calculated constant-moment rigid-body solution. Pivot drift and radius consistency separately verify the finite-rotation constraints.
Overview
Validated against Constant-moment rigid rectangular crank.
Headline comparison — Angular trajectory: 0.668% acceleration and 0.564% final-angle deviation.
Geometry and simulation setup
Flexible rectangular crank coupled to a ground revolute joint through an RBE2 root attachment.
Tangential follower traction; Newmark average-acceleration integration; 200 steps at dt = 0.005 s; one complete nominal revolution.
Parameter values
| Parameter | Value |
|---|
| Elapsed s | 76.4577 |
| Length m | 0.5 |
| Width m | 0.08 |
| Thickness m | 0.04 |
| E Pa | 2.1e+11 |
| Nu | 0.3 |
| Rho kg m3 | 7,800 |
Assessment
The unwrapped free-end trajectory is compared with the independently calculated constant-moment rigid-body solution. Pivot drift and radius consistency separately verify the finite-rotation constraints.
Structural / Flexible multibody dynamics
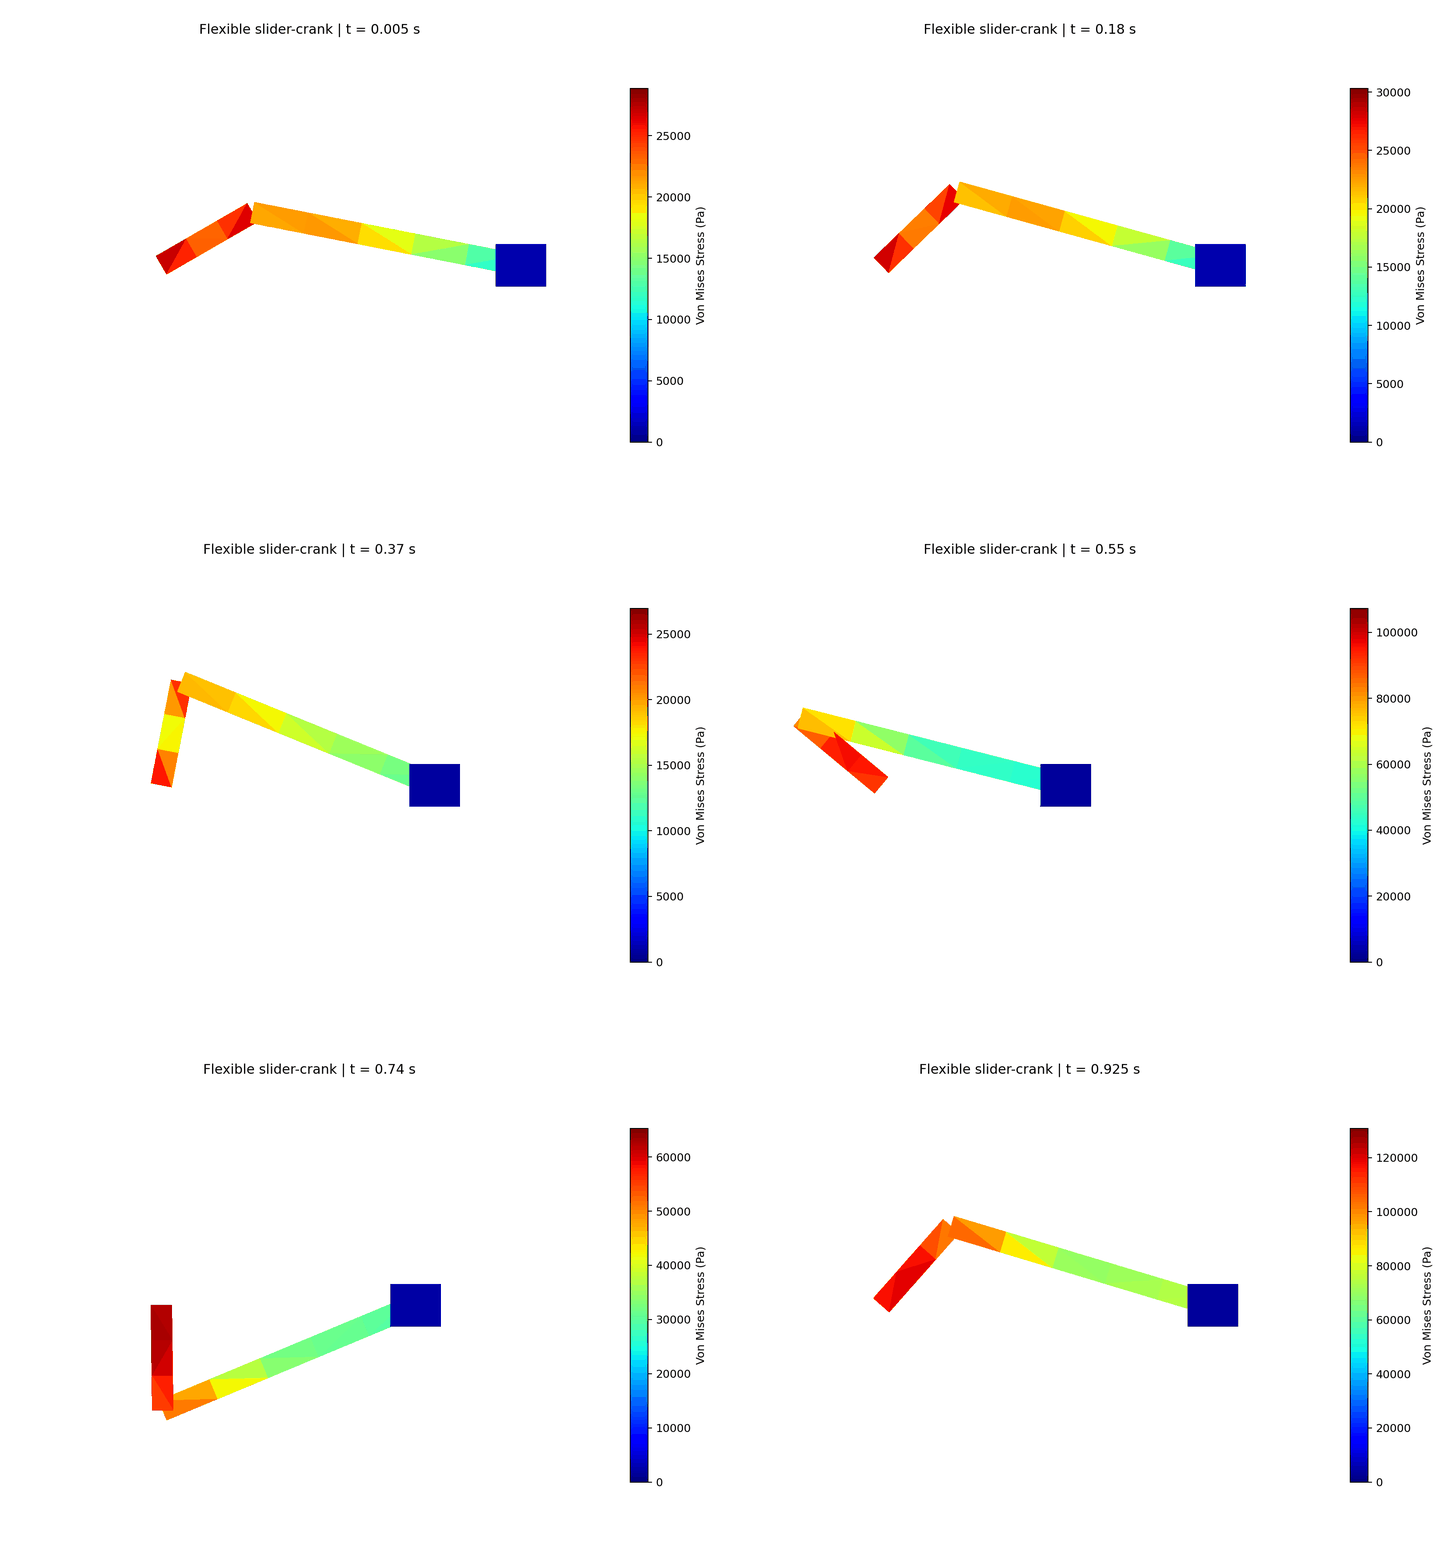
Flexible slider-crank mechanism
Exact rigid slider-crank closure relation
Criterion met
Quantitative comparison
Piston trajectory: 0.000145% RMS error relative to stroke
Geometry
Flexible crank and connecting rod coupled to a guided flexible piston through three revolute joints and an RBE2 frame network.
Model parameters
12 N m follower moment; Newmark average-acceleration integration; 185 steps at dt = 0.005 s; 378.52 degrees of continuous crank travel.
Assessment method
The computed piston trajectory is compared throughout the motion with the exact rigid slider-crank closure relation. Rod-length consistency, piston-guide error, crank-root drift, and the full-rank 17-row joint Jacobian provide independent constraint checks.
Overview
Validated against Exact rigid slider-crank closure relation.
Headline comparison — Piston trajectory: 0.000145% RMS error relative to stroke.
Geometry and simulation setup
Flexible crank and connecting rod coupled to a guided flexible piston through three revolute joints and an RBE2 frame network.
12 N m follower moment; Newmark average-acceleration integration; 185 steps at dt = 0.005 s; 378.52 degrees of continuous crank travel.
Parameter values
| Parameter | Value |
|---|
| Elapsed s | 113.2731 |
| Crank length m | 0.25 |
| Connecting rod length m | 0.65 |
| Link cross section m | 0.05, 0.04 |
| Piston dimensions m | 0.12, 0.1, 0.08 |
| Initial crank angle deg | 30 |
| E Pa | 2.1e+11 |
| Nu | 0.3 |
| Rho kg m3 | 7,800 |
Assessment
The computed piston trajectory is compared throughout the motion with the exact rigid slider-crank closure relation. Rod-length consistency, piston-guide error, crank-root drift, and the full-rank 17-row joint Jacobian provide independent constraint checks.
Structural / Geometric nonlinearity
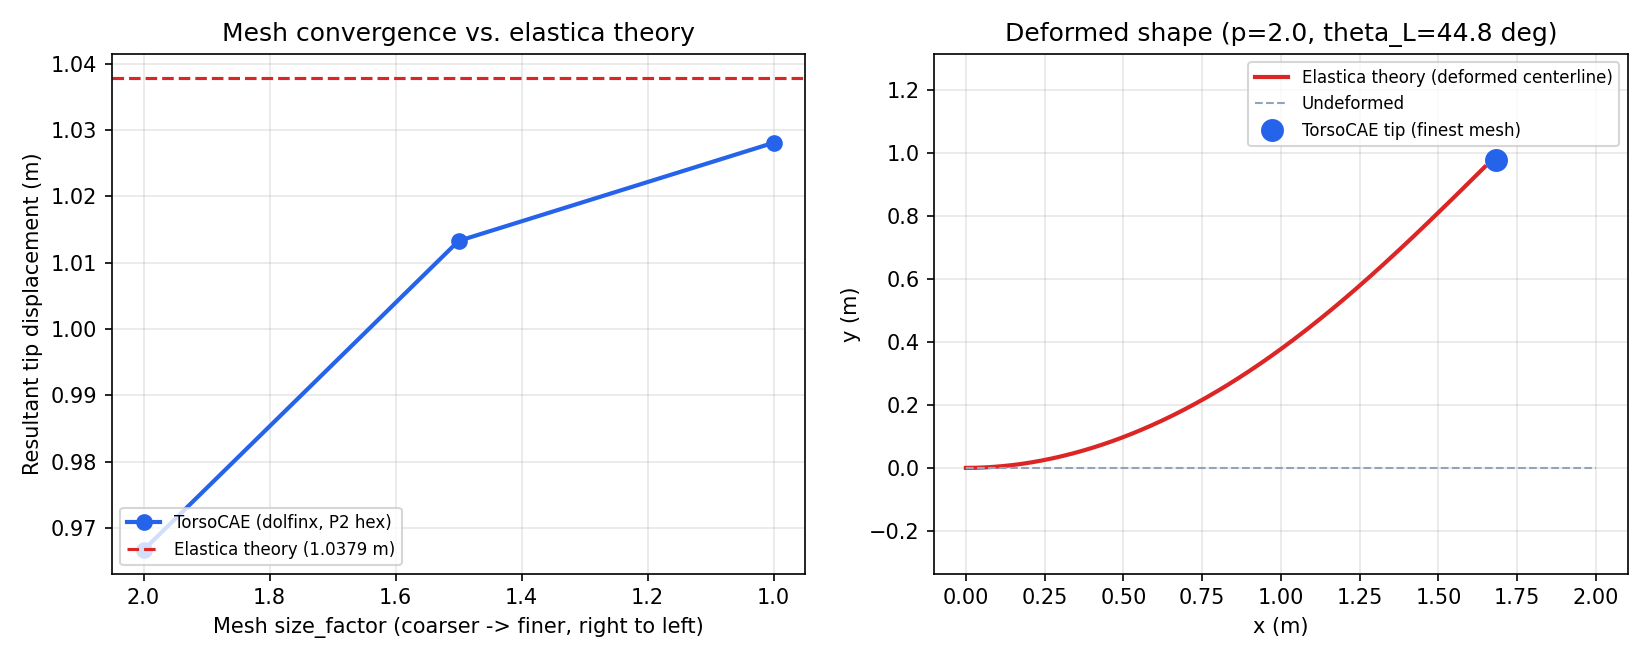
Cantilever elastica
Bisshopp and Drucker (1945) elastica
Criterion met
Quantitative comparison
Resultant tip displacement: 0.95% relative deviation
Geometry
2.0 x 0.1 x 0.1 m cantilever with quadratic hexahedral elements.
Model parameters
Large transverse end traction; 20 load steps; finite-strain geometric nonlinear formulation.
Assessment method
The final tip displacement and direction are compared with a numerically evaluated elliptic-integral reference at 44.8 degrees tip rotation.
Overview
Validated against Bisshopp and Drucker (1945) elastica.
Reference: Bisshopp & Drucker, 'Large Deflection of Cantilever Beams', Q. Appl. Math. 3(3), 272-275 (1945)
Headline comparison — Resultant tip displacement: 0.95% relative deviation.
Geometry and simulation setup
2.0 x 0.1 x 0.1 m cantilever with quadratic hexahedral elements.
Large transverse end traction; 20 load steps; finite-strain geometric nonlinear formulation.
Parameter values
| Parameter | Value |
|---|
| L m | 2 |
| Cross section m | 0.1, 0.1 |
| E Pa | 2.1e+11 |
| Nu | 0.3 |
Results
| Quantity | Value |
|---|
| Final error (%) | 0.9464 |
| Final dy error (%) | 0.8832 |
| Pass | Yes |
Mesh convergence
| Size factor | Max displacement m | Max von mises pa | Elapsed s | Tip dx m | Tip dy m | Dx analytical m |
|---|
| 2 | 0.9702 | 5.865e+09 | 62.1346 | -0.2827 | 0.9244 | -0.3213 |
| 1.5 | 1.0168 | 6.65e+09 | 390.0359 | -0.3083 | 0.9652 | -0.3213 |
| 1 | 1.0316 | 7.348e+09 | 1,745.8695 | -0.3163 | 0.9782 | -0.3213 |
Assessment
The final tip displacement and direction are compared with a numerically evaluated elliptic-integral reference at 44.8 degrees tip rotation.
Structural / Geometric nonlinearity
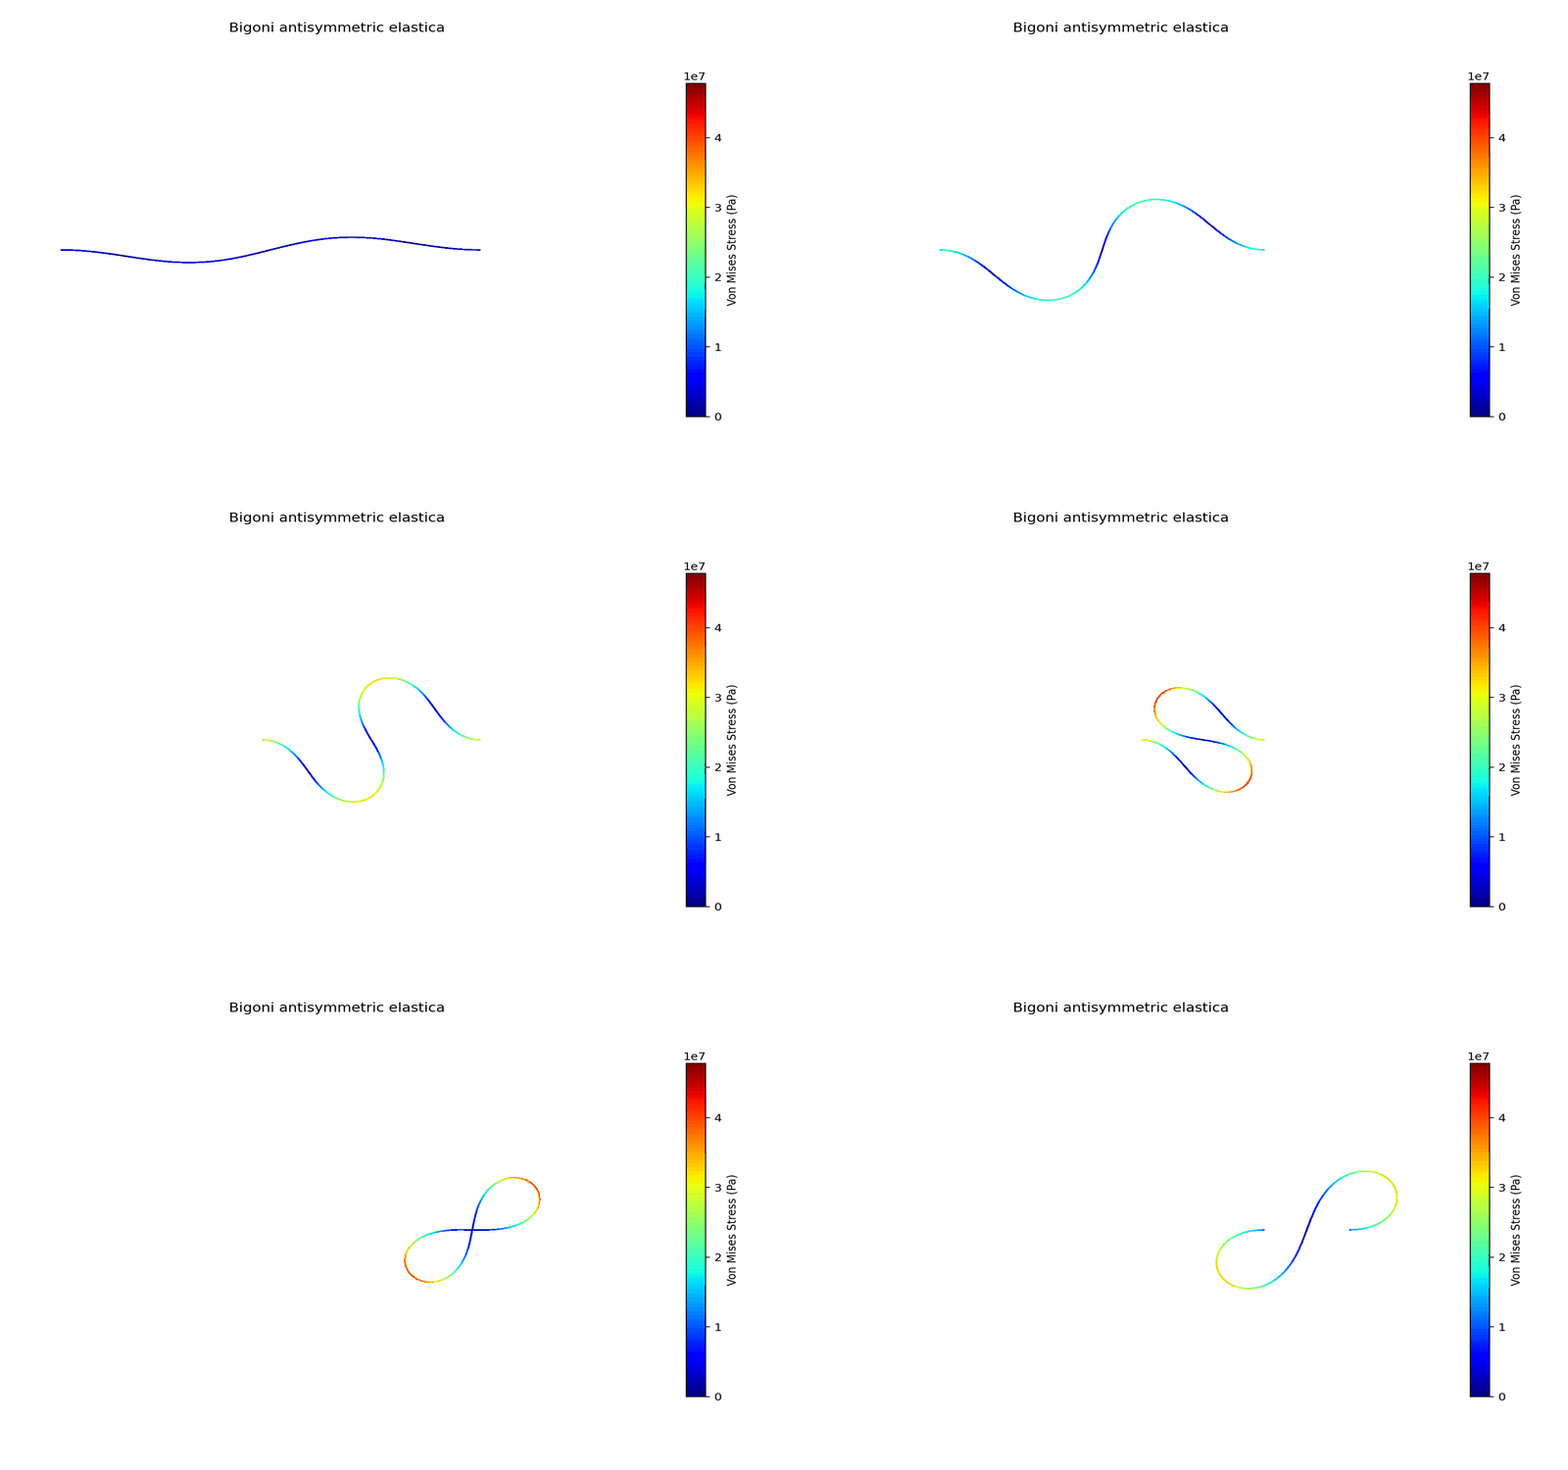
Doubly clamped antisymmetric elastica
Bigoni (2015) exact elastica
Criterion met
Quantitative comparison
Centerline: 0.0785% L maximum; 0.0557% L RMS deviation
Geometry
490 x 25 x 1.5 mm doubly clamped strip with prescribed end shortening of 1.2 L.
Model parameters
Total-Lagrangian geometric nonlinearity; 0.002 L antisymmetric branch-selection imperfection; 96 increments; two MPI ranks.
Assessment method
The complete computed centerline is compared pointwise with an independent numerical solution of Bigoni's inextensible-elastica boundary-value equations for the stable antisymmetric second branch.
Overview
Validated against the stable antisymmetric second-mode elastica derived by Bigoni (2015).
At normalized end shortening |u1(L)|/L = 1.2, the TorsoCAE centerline differs from the independent analytical solution by 0.0785% L maximum and 0.0557% L RMS.
The reference boundary-value problem converged to a maximum RMS residual below 1.0e-9.
Geometry and simulation setup
The 490 x 25 x 1.5 mm strip uses the experimental dimensions reported by Bigoni.
A structured 2,415-node, 1,280-element Hex8 mesh is solved in 96 load increments on two MPI ranks.
Parameter values
| Parameter | Value |
|---|
| Young's modulus | 3.0 GPa |
| Poisson ratio | 0.35 |
| Normalized end shortening | 1.2 |
| Branch-selection imperfection | 0.002 L |
Results
| Quantity | TorsoCAE | Bigoni elastica | Deviation |
|---|
| Lower lobe z/L | -0.159625 | -0.159329 | 0.000295 |
| Upper lobe z/L | 0.159625 | 0.159329 | 0.000295 |
| Maximum centerline error | 0.0785% L | - | below 5% |
| RMS centerline error | 0.0557% L | - | below 5% |
| Pass | Yes | - | - |
Assessment scope
The small antisymmetric imperfection selects the second branch; axial shortening alone is not claimed to discover the secondary bifurcation.
This case validates the equilibrium shape. Automatic snap-through and reaction magnitude are outside its acceptance criterion and are not presented as validated results.
Structural / Geometric nonlinearity
Glaser-Armero S-shaped beam objectivity
Glaser and Armero (1997) finite-rotation objectivity benchmark
Criterion met
Quantitative comparison
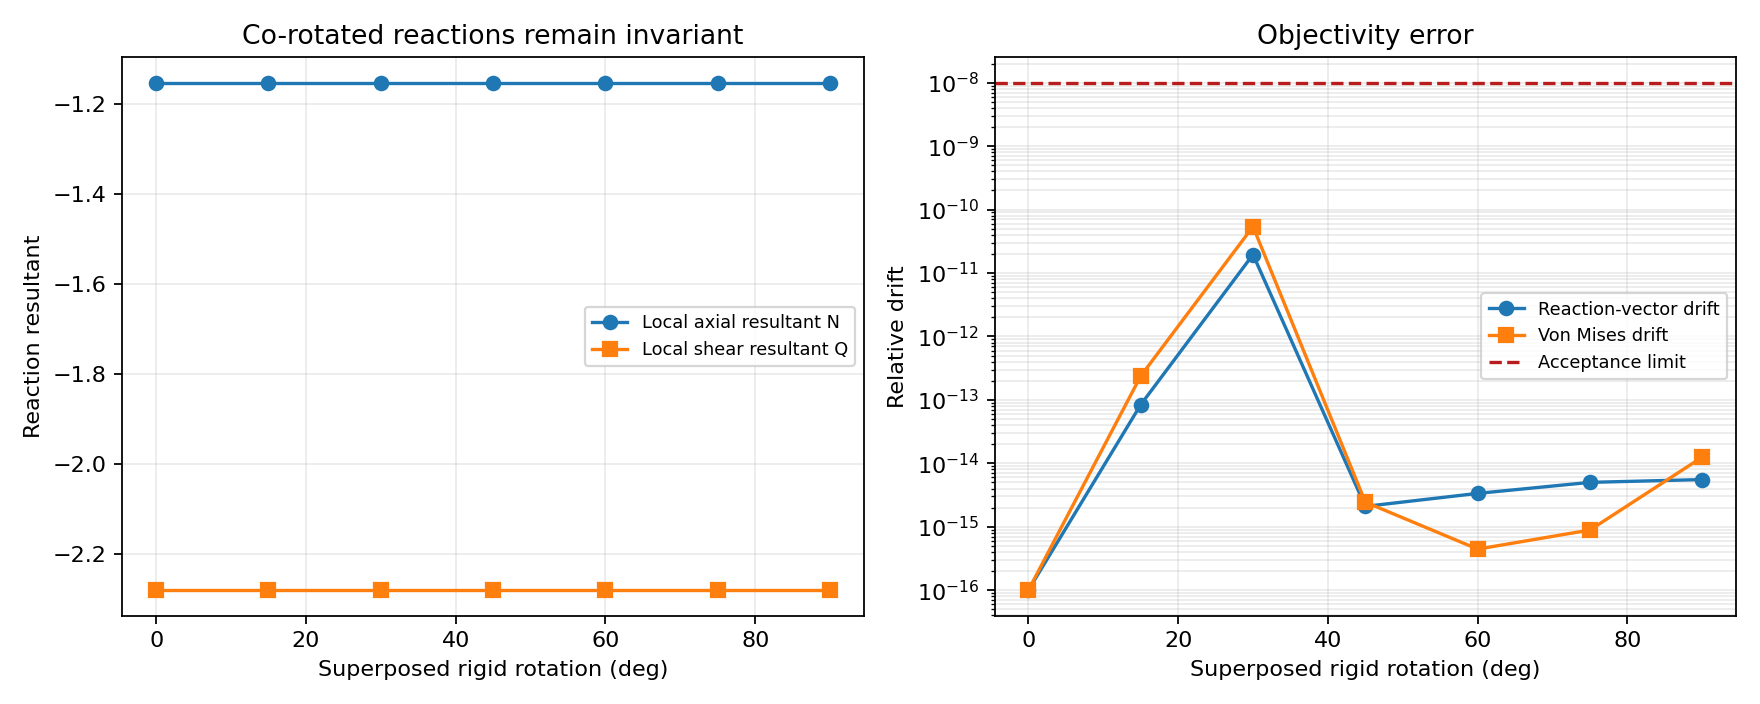
Maximum reaction drift 1.95e-11; maximum stress drift 5.39e-11
Geometry
Unit-length solid beam with height 0.2 and width 1.0, driven into an S-shape before a superposed 0-90 degree rigid rotation.
Model parameters
St. Venant-Kirchhoff total-Lagrangian formulation; prescribed end kinematics; plane-strain restraint; seven orientations; two MPI ranks.
Assessment method
Objectivity is assessed by transforming the physical end reaction back into the beam frame and checking that both this reaction and the Cauchy stress remain invariant under rigid rotation.
Overview
Validated against the finite-rotation objectivity sequence of Glaser and Armero (1997).
The S-shaped deformation is held fixed while a rigid rotation is superposed from 0 to 90 degrees.
The maximum relative co-rotated reaction drift is 1.95e-11 and the maximum relative von Mises drift is 5.39e-11.
Geometry and simulation setup
The beam has length 1.0, height 0.2, width 1.0, and a prescribed right-end transverse shift of 0.2.
A structured 28-node, 6-element Hex8 mesh is solved on two MPI ranks.
Parameter values
| Parameter | Value |
|---|
| Shear modulus | 100 |
| Bulk modulus | 116.6666667 |
| Rigid rotation | 0-90 deg |
| Load steps per orientation | 24 |
Results
| Quantity | Value |
|---|
| Maximum local reaction drift | 1.9511e-11 |
| Maximum von Mises drift | 5.3918e-11 |
| Acceptance limit | 1.0e-8 |
| Pass | Yes |
Assessment scope
The constitutive model differs from the enhanced-strain element in the reference, so response magnitudes are not compared.
The persisted result currently exposes reaction forces rather than reaction moments; this case validates axial/shear reaction and stress objectivity without claiming the reference moment curve.
Structural / Geometric nonlinearity
Cook's membrane
Mesh self-convergence for the nonlinear 3D setup
Criterion met
Quantitative comparison
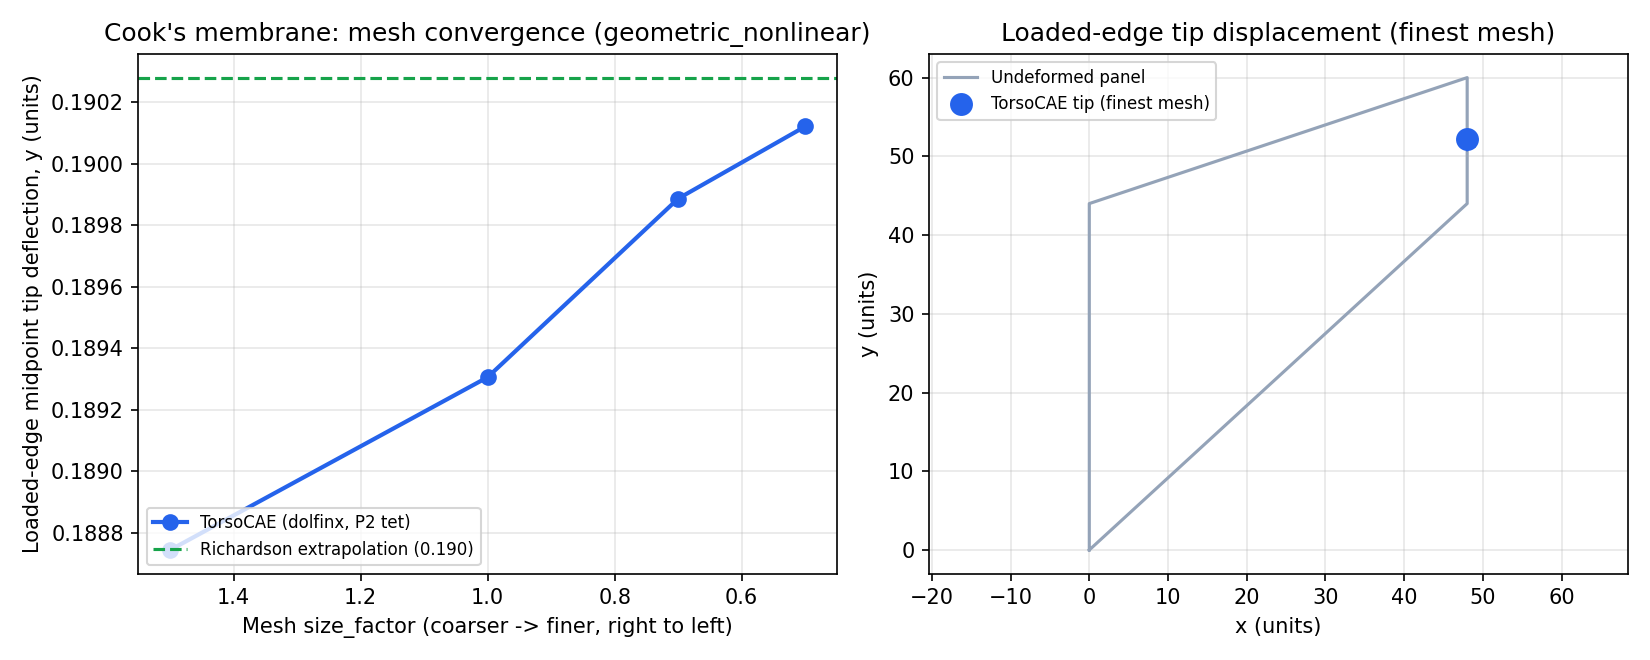
0.12% change across the finest resolutions
Geometry
Tapered Cook membrane extruded into a three-dimensional solid.
Model parameters
500 Pa end load; four mesh resolutions from 247 to 1888 displacement DOFs; load-bisected nonlinear solve.
Assessment method
The assessment quantifies asymptotic mesh stability for this nonlinear three-dimensional parameterization. No external displacement reference is asserted for this specific loading configuration.
Overview
Validated against Mesh self-convergence for the nonlinear 3D setup.
Reference: Cook, R.D. (1974); geometry per the widely used Cook 1974 tapered-panel benchmark
Headline comparison — 0.12% change across the finest resolutions.
Geometry and simulation setup
Tapered Cook membrane extruded into a three-dimensional solid.
500 Pa end load; four mesh resolutions from 247 to 1888 displacement DOFs; load-bisected nonlinear solve.
Parameter values
| Parameter | Value |
|---|
| Thickness m | 1 |
| E Pa | 1e+06 |
| Nu | 0.3 |
Results
| Quantity | Value |
|---|
| Self convergence (%) | 0.1235 |
| Pass | Yes |
Mesh convergence
| Size factor | N dofs | Max displacement m | Max von mises pa | Tip dy | Elapsed s |
|---|
| 1.5 | 247 | 0.243 | 1,878.7474 | 0.1887 | 3.6969 |
| 1 | 516 | 0.2455 | 1,990.6108 | 0.1893 | 4.7888 |
| 0.7 | 1,023 | 0.247 | 2,396.6827 | 0.1899 | 6.916 |
| 0.5 | 1,888 | 0.2485 | 2,810.2014 | 0.1901 | 11.0922 |
Assessment
The assessment quantifies asymptotic mesh stability for this nonlinear three-dimensional parameterization. No external displacement reference is asserted for this specific loading configuration.
Structural / Geometric nonlinear dynamics
Swinging flexible plate
Independent rigid compound-pendulum ODE
Criterion met
Quantitative comparison
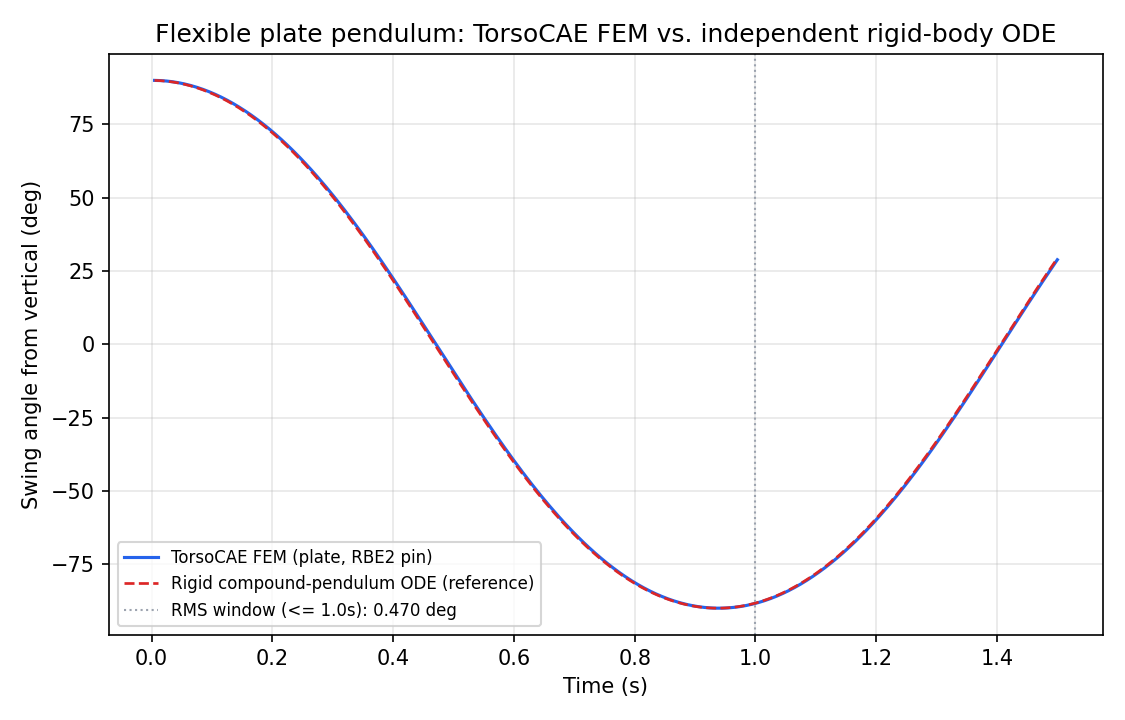
Angular trajectory: 0.47 degree RMS deviation over the first half-swing
Geometry
Flexible plate suspended from a finite-rotation pivot attachment.
Model parameters
Gravity-driven geometric nonlinear dynamics; mass properties for the reference are computed from geometry rather than fitted.
Assessment method
The trajectory is compared with an independent compound-pendulum ODE whose mass properties are derived directly from the modeled geometry. This reference is used because the relevant published beam response is available only graphically and does not support a precise numerical comparison.
Overview
Validated against Independent rigid compound-pendulum ODE.
Headline comparison — Angular trajectory: 0.47 degree RMS deviation over the first half-swing.
Geometry and simulation setup
Flexible plate suspended from a finite-rotation pivot attachment.
Gravity-driven geometric nonlinear dynamics; mass properties for the reference are computed from geometry rather than fitted.
Parameter values
| Parameter | Value |
|---|
| Primary window s | 1 |
| Elapsed s | 70.6722 |
| Plate m | 1, 0.2, 0.02 |
| Hole r m | 0.04 |
| Hole center xy | 0.08, 0 |
| E Pa | 2.1e+11 |
| Nu | 0.3 |
| Rho kg m3 | 7,800 |
Results
Root/tip markers (x=0 and x=1 face centroids) tracked over time from the SCVZ result-frame history; rotation angle recovered via atan2 of their relative vector (any two rigid-body material points suffice -- the pivot itself, tag 7, need not be one of the markers). Compared against an independent nonlinear rigid compound-pendulum ODE (scipy solve_ivp DOP853, rtol=1e-12) using the plate's own mass/I_pivot/pivot-to-COM distance, computed directly from its geometry (not fit), released from the same rest-horizontal initial condition.
| Quantity | Value |
|---|
| Rms angle error deg | 0.4701 |
| Final error (%) | 0.4701 |
| Pass | Yes |
Rms angle error by window
| Window s | Rms angle deg |
|---|
| 0.5 | 0.5144 |
| 1 | 0.4701 |
| 1.5 | 0.4585 |
Assessment
The trajectory is compared with an independent compound-pendulum ODE whose mass properties are derived directly from the modeled geometry. This reference is used because the relevant published beam response is available only graphically and does not support a precise numerical comparison.
Structural / Hyperelasticity
Treloar uniaxial tension
Treloar (1944) real experimental data, 3-term Ogden fit
Criterion met
Quantitative comparison
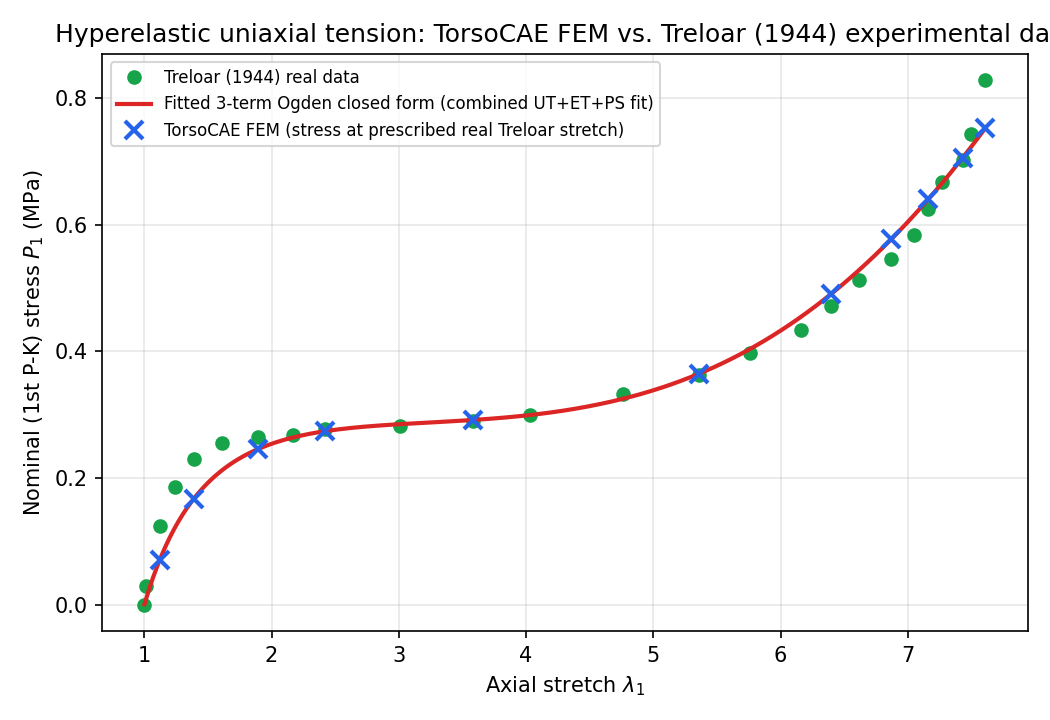
R-squared = 0.970 against real Treloar stress data
Geometry
4.0 x 2.0 x 2.0 homogeneous hyperelastic block.
Model parameters
3-term Ogden material fit simultaneously to real Treloar uniaxial, equibiaxial, and pure-shear data; real measured stretch applied as a displacement boundary condition; 20 nonlinear load steps.
Assessment method
The primary acceptance criterion is direct agreement between the finite-element nominal stress and Treloar's real measured stress at the same real measured stretch. Finite-element agreement with the material model's own closed-form solution is reported separately as a numerical solver check.
Overview
Validated against Treloar (1944) real experimental data, 3-term Ogden fit.
Reference: Treloar, L.R.G. (1944), Trans. Faraday Soc. 40; data digitized via github.com/OVGU-CoMe/treloar_fit (Data_Treloar_UT.mat)
Headline comparison — R-squared = 0.970 against real Treloar stress data.
Geometry and simulation setup
4.0 x 2.0 x 2.0 homogeneous hyperelastic block.
3-term Ogden material fit simultaneously to real Treloar uniaxial, equibiaxial, and pure-shear data; real measured stretch applied as a displacement boundary condition; 20 nonlinear load steps.
Parameter values
| Parameter | Value |
|---|
| L m | 4 |
| Cross section m | 2, 2 |
Results
Real Treloar-measured STRETCH applied as an axial-only displacement BC (lateral faces free); FEM nominal stress (from Cauchy stress at the known homogeneous J) compared directly to Treloar's actual measured stress.
| Quantity | Value |
|---|
| Max fem vs closedform error (%) | 4.219e-07 |
| Rms fem vs data MPa | 0.0364 |
| R2 fem vs data | 0.9705 |
| Solver pass | Yes |
| Data pass | Yes |
| Pass | Yes |
Points
| Lambda1 data | S data MPa | Lambda1 fem | P1 fem MPa | P1 closedform MPa | Fem vs data error (%) | Fem vs closedform error (%) |
|---|
| 1.12 | 0.125 | 1.12 | 0.0703 | 0.0703 | 43.7455 | 9.977e-10 |
| 1.39 | 0.2302 | 1.39 | 0.1677 | 0.1677 | 27.1588 | 3.427e-10 |
| 1.89 | 0.2646 | 1.89 | 0.2454 | 0.2454 | 7.2468 | 1.707e-09 |
| 2.42 | 0.2769 | 2.42 | 0.2739 | 0.2739 | 1.0705 | 5.751e-09 |
| 3.58 | 0.2905 | 3.58 | 0.2916 | 0.2916 | 0.3849 | 3.853e-08 |
| 5.36 | 0.3619 | 5.36 | 0.3648 | 0.3648 | 0.7894 | 2.088e-07 |
| 6.4 | 0.4719 | 6.4 | 0.491 | 0.491 | 4.049 | 3.34e-07 |
| 6.87 | 0.5459 | 6.87 | 0.577 | 0.577 | 5.6944 | 3.772e-07 |
| 7.16 | 0.6243 | 7.16 | 0.6399 | 0.6399 | 2.4931 | 3.98e-07 |
| 7.43 | 0.7012 | 7.43 | 0.7053 | 0.7053 | 0.5835 | 4.135e-07 |
| 7.61 | 0.8279 | 7.61 | 0.7526 | 0.7526 | 9.0935 | 4.219e-07 |
Assessment
The primary acceptance criterion is direct agreement between the finite-element nominal stress and Treloar's real measured stress at the same real measured stretch. Finite-element agreement with the material model's own closed-form solution is reported separately as a numerical solver check.
Structural / Hyperelasticity
Treloar equibiaxial tension
Treloar (1944) real experimental data, 3-term Ogden fit
Criterion met
Quantitative comparison
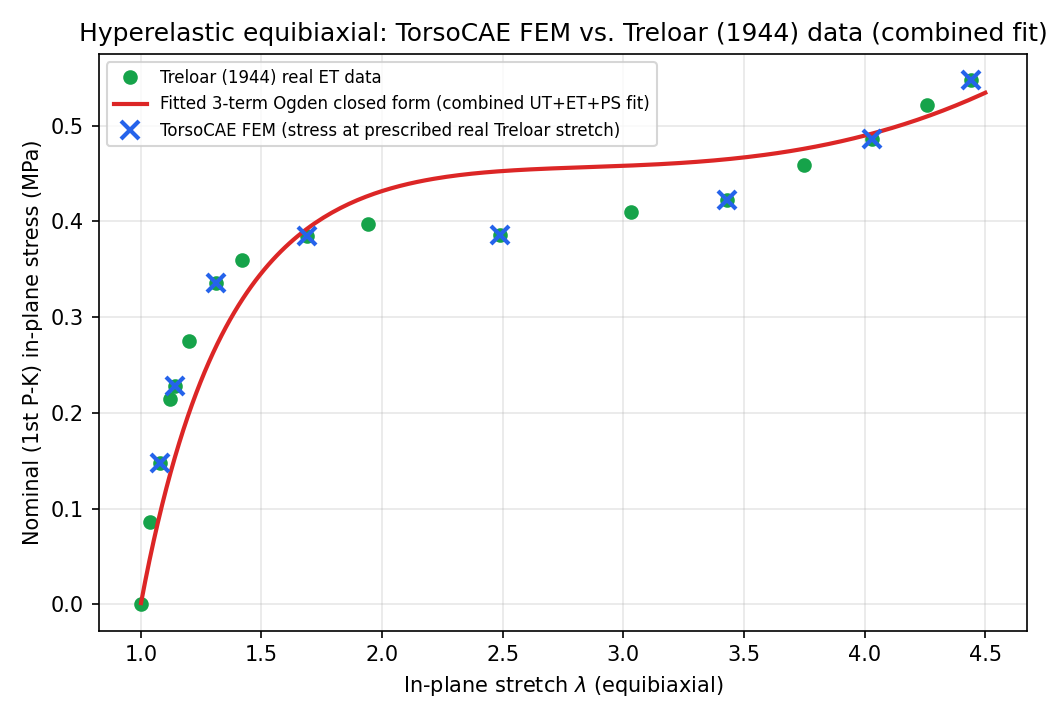
R-squared = 0.833 against real Treloar stress data
Geometry
4.0 x 4.0 x 0.5 homogeneous hyperelastic sheet.
Model parameters
Same 3-term Ogden material as the uniaxial case, fit simultaneously to all three real Treloar loading modes; real measured equibiaxial stretch applied as displacement boundary conditions on both in-plane faces.
Assessment method
The primary acceptance criterion is direct agreement between the finite-element nominal stress and Treloar's real measured equibiaxial stress at the same real measured stretch. Finite-element agreement with the closed-form solution is reported separately as a numerical solver check.
Overview
Validated against Treloar (1944) real experimental data, 3-term Ogden fit.
Reference: Treloar, L.R.G. (1944), Trans. Faraday Soc. 40; data digitized via github.com/OVGU-CoMe/treloar_fit (Data_Treloar_ET.mat)
Headline comparison — R-squared = 0.833 against real Treloar stress data.
Geometry and simulation setup
4.0 x 4.0 x 0.5 homogeneous hyperelastic sheet.
Same 3-term Ogden material as the uniaxial case, fit simultaneously to all three real Treloar loading modes; real measured equibiaxial stretch applied as displacement boundary conditions on both in-plane faces.
Parameter values
| Parameter | Value |
|---|
| Side m | 4 |
| Thickness m | 0.5 |
Results
Real Treloar-measured STRETCH applied as axial-only displacement BCs on both in-plane faces (thickness free); FEM nominal stress (from Cauchy stress at the known homogeneous J) compared directly to Treloar's actual measured stress.
| Quantity | Value |
|---|
| Max fem vs closedform error (%) | 1.453e-08 |
| Rms fem vs data MPa | 0.0498 |
| R2 fem vs data | 0.8328 |
| Solver pass | Yes |
| Data pass | Yes |
| Pass | Yes |
Points
| Lambda data | S data MPa | Lambda fem | Lambda3 fem thickness | P fem MPa | P closedform MPa | Fem vs data error (%) |
|---|
| 1.08 | 0.1481 | 1.08 | 0.8624 | 0.0951 | 0.0951 | 35.7554 |
| 1.14 | 0.2281 | 1.14 | 0.7772 | 0.1523 | 0.1523 | 33.2298 |
| 1.31 | 0.3359 | 1.31 | 0.5944 | 0.2682 | 0.2682 | 20.1692 |
| 1.69 | 0.3846 | 1.69 | 0.3631 | 0.3923 | 0.3923 | 2.009 |
| 2.49 | 0.3855 | 2.49 | 0.1712 | 0.4523 | 0.4523 | 17.3262 |
| 3.43 | 0.4227 | 3.43 | 0.0923 | 0.4648 | 0.4648 | 9.9611 |
| 4.03 | 0.4864 | 4.03 | 0.068 | 0.4915 | 0.4915 | 1.0425 |
| 4.44 | 0.5473 | 4.44 | 0.0569 | 0.5275 | 0.5275 | 3.6227 |
Assessment
The primary acceptance criterion is direct agreement between the finite-element nominal stress and Treloar's real measured equibiaxial stress at the same real measured stretch. Finite-element agreement with the closed-form solution is reported separately as a numerical solver check.
Structural / Hyperelasticity
Treloar pure shear
Treloar (1944) real experimental data, 3-term Ogden fit
Criterion met
Quantitative comparison
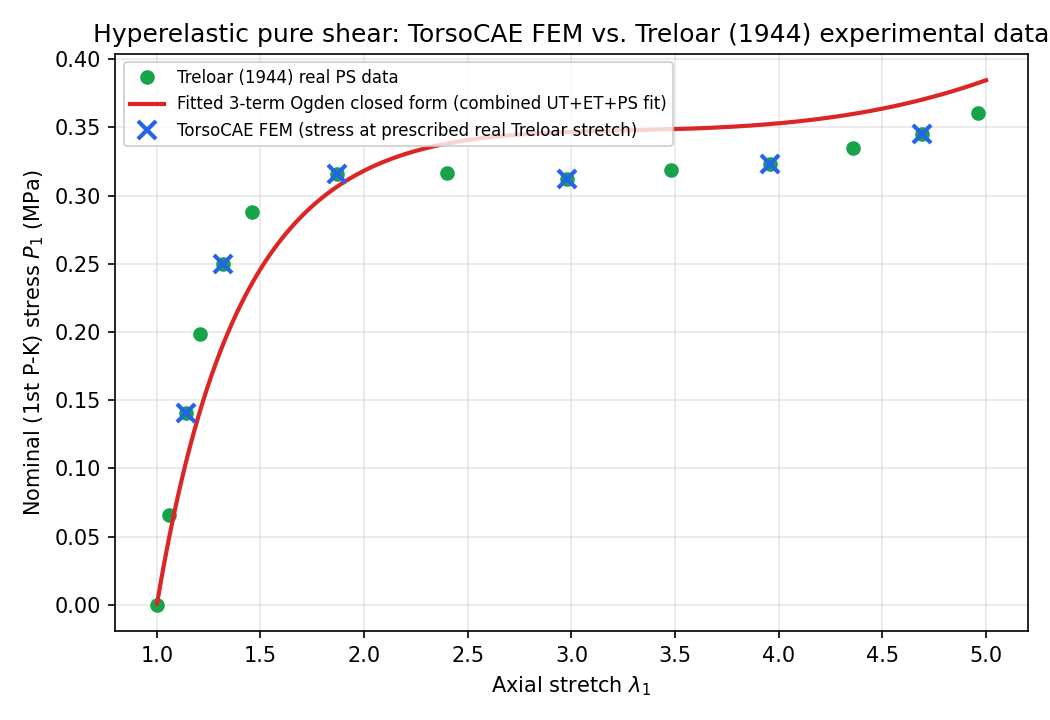
R-squared = 0.739 against real Treloar stress data
Geometry
4.0 x 8.0 x 0.5 homogeneous hyperelastic strip, gripped along both long edges.
Model parameters
Same 3-term Ogden material as the uniaxial and equibiaxial cases; real measured pure-shear stretch applied as an axial displacement boundary condition with both long edges held to enforce the plane-strain state.
Assessment method
The primary acceptance criterion is direct agreement between the finite-element nominal stress and Treloar's real measured pure-shear stress at the same real measured stretch. Finite-element agreement with the closed-form solution is reported separately as a numerical solver check.
Overview
Validated against Treloar (1944) real experimental data, 3-term Ogden fit.
Reference: Treloar, L.R.G. (1944), Trans. Faraday Soc. 40; data digitized via github.com/OVGU-CoMe/treloar_fit (Data_Treloar_PS.mat)
Headline comparison — R-squared = 0.739 against real Treloar stress data.
Geometry and simulation setup
4.0 x 8.0 x 0.5 homogeneous hyperelastic strip, gripped along both long edges.
Same 3-term Ogden material as the uniaxial and equibiaxial cases; real measured pure-shear stretch applied as an axial displacement boundary condition with both long edges held to enforce the plane-strain state.
Parameter values
| Parameter | Value |
|---|
| L m | 4 |
| W m | 8 |
| Thickness m | 0.5 |
Results
Real Treloar-measured STRETCH applied as an axial-only displacement BC; width rigidly gripped (uy=0) on both long edges to enforce the plane-strain pure-shear state; FEM nominal stress (from Cauchy stress at the known homogeneous J) compared directly to Treloar's actual measured stress.
| Quantity | Value |
|---|
| Max fem vs closedform error (%) | 1.702e-10 |
| Rms fem vs data MPa | 0.0354 |
| R2 fem vs data | 0.7389 |
| Solver pass | Yes |
| Data pass | Yes |
| Pass | Yes |
Points
| Lambda1 data | S data MPa | Lambda1 fem | Lambda3 fem thickness | P1 fem MPa | P1 closedform MPa | Fem vs data error (%) |
|---|
| 1.14 | 0.1404 | 1.14 | 0.8817 | 0.1042 | 0.1042 | 25.7497 |
| 1.32 | 0.25 | 1.32 | 0.7656 | 0.1911 | 0.1911 | 23.5593 |
| 1.87 | 0.3155 | 1.87 | 0.5473 | 0.3066 | 0.3066 | 2.8077 |
| 2.98 | 0.3121 | 2.98 | 0.3491 | 0.3466 | 0.3466 | 11.0603 |
| 3.96 | 0.3232 | 3.96 | 0.2657 | 0.3525 | 0.3525 | 9.06 |
| 4.69 | 0.3454 | 4.69 | 0.2265 | 0.3703 | 0.3703 | 7.2113 |
Assessment
The primary acceptance criterion is direct agreement between the finite-element nominal stress and Treloar's real measured pure-shear stress at the same real measured stretch. Finite-element agreement with the closed-form solution is reported separately as a numerical solver check.
Structural / Linear elasticity
Cantilever tip deflection
Euler-Bernoulli beam solution
Criterion met
Quantitative comparison
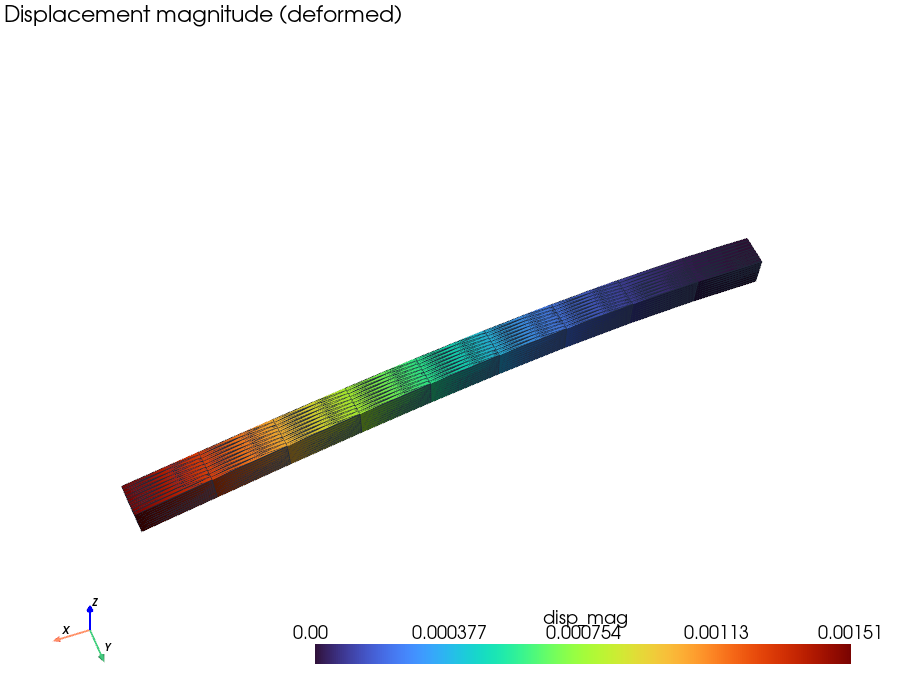
Tip deflection: 1.02% relative deviation
Geometry
2.0 x 0.1 x 0.1 m solid cantilever with quadratic hexahedral elements.
Model parameters
Steel elastic properties; 1000 N resultant end traction; fixed root; mesh-convergence sweep.
Assessment method
The transverse tip displacement is compared with beam theory while mesh refinement checks convergence of the three-dimensional solid model.
Overview
Validated against Euler-Bernoulli beam solution.
Headline comparison — Tip deflection: 1.02% relative deviation.
Geometry and simulation setup
2.0 x 0.1 x 0.1 m solid cantilever with quadratic hexahedral elements.
Steel elastic properties; 1000 N resultant end traction; fixed root; mesh-convergence sweep.
Parameter values
| Parameter | Value |
|---|
| Analytical tip deflection m | 0.0015 |
| L m | 2 |
| Cross section m | 0.1, 0.1 |
| E Pa | 2.1e+11 |
| Nu | 0.3 |
Results
| Quantity | Value |
|---|
| Final error (%) | 1.0168 |
| Pass | Yes |
Mesh convergence
| Size factor | Max displacement m | Analytical m | Error (%) | Elapsed s |
|---|
| 2 | 0.0015 | 0.0015 | 3.0989 | 2.1225 |
| 1.5 | 0.0015 | 0.0015 | 1.7487 | 3.2524 |
| 1 | 0.0015 | 0.0015 | 1.0168 | 10.9808 |
Assessment
The transverse tip displacement is compared with beam theory while mesh refinement checks convergence of the three-dimensional solid model.
Structural / Linear elasticity
Plate with a circular hole
Kirsch (1898), stress concentration Kt = 3
Criterion met
Quantitative comparison
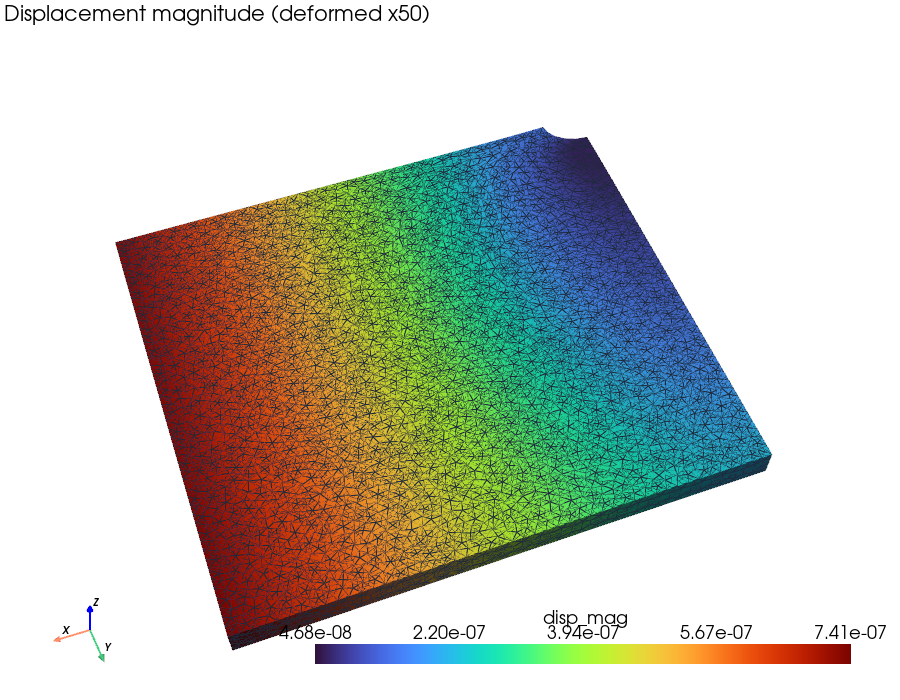
Stress concentration factor: 0.17% relative deviation
Geometry
Symmetry-reduced plate sector with a 0.01 m circular hole and finite thickness.
Model parameters
1 MPa remote tension; quadratic tetrahedral mesh; symmetry constraints on the cut planes.
Assessment method
The maximum principal stress at the hole is normalized by the far-field stress and compared with the Kirsch concentration factor.
Overview
Validated against Kirsch (1898), stress concentration Kt = 3.
Headline comparison — Stress concentration factor: 0.17% relative deviation.
Geometry and simulation setup
Symmetry-reduced plate sector with a 0.01 m circular hole and finite thickness.
1 MPa remote tension; quadratic tetrahedral mesh; symmetry constraints on the cut planes.
Parameter values
| Parameter | Value |
|---|
| Hole radius m | 0.01 |
| Quarter half x m | 0.15 |
| Quarter half y m | 0.15 |
| Thickness m | 0.02 |
| Full plate width over hole diameter | 15 |
| E Pa | 2.1e+11 |
| Nu | 0.3 |
Results
| Quantity | Value |
|---|
| Kt theory | 3 |
| Final error (%) | 0.1693 |
| Pass | Yes |
Mesh convergence
| Size factor | Max p1 Pa | Kt fem | Kt theory | Error (%) | Elapsed s |
|---|
| 0.35 | 2.701e+06 | 2.7013 | 3 | 9.9569 | 23.6929 |
| 0.2 | 2.891e+06 | 2.8914 | 3 | 3.6192 | 41.0437 |
| 0.15 | 3.005e+06 | 3.0051 | 3 | 0.1693 | 105.0715 |
Assessment
The maximum principal stress at the hole is normalized by the far-field stress and compared with the Kirsch concentration factor.
Structural / Shell analysis
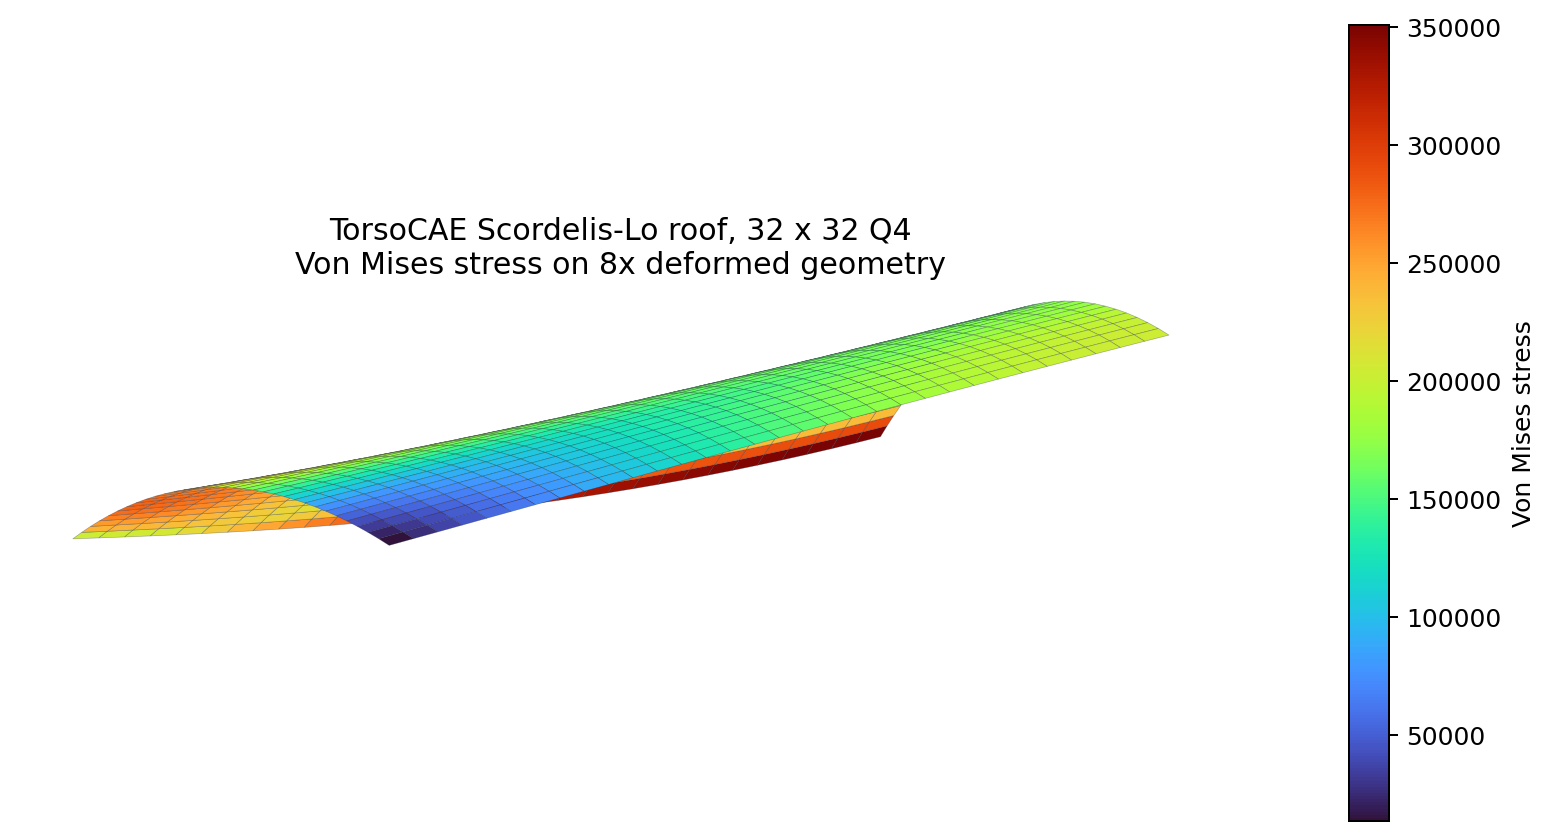
Scordelis-Lo cylindrical roof
Ko, Lee and Bathe (2017), reference displacement -0.3024
Criterion met
Quantitative comparison
Free-edge displacement: 0.623% relative deviation
Geometry
Quarter-symmetry cylindrical roof with radius 25, full length 50, 40 degree half-angle and thickness 0.25.
Model parameters
E = 4.32e8; nu = 0; surface self-weight = 90; regular MITC4+ quadrilateral meshes; two-rank MPI.
Assessment method
The vertical displacement at the midpoint of the free edge is tracked through four mesh levels and compared with both the accepted -0.3024 reference and the published MITC4+ convergence sequence.
Overview
Validated against Ko, Lee and Bathe (2017), reference displacement -0.3024.
Reference: Ko, Y., Lee, P.-S., and Bathe, K.-J. (2017), Performance of the MITC3+ and MITC4+ shell elements in widely-used benchmark problems, Computers & Structures 193, 187-206, doi:10.1016/j.compstruc.2017.08.003
Headline comparison — Free-edge displacement: 0.623% relative deviation.
Geometry and simulation setup
Quarter-symmetry cylindrical roof with radius 25, full length 50, 40 degree half-angle and thickness 0.25.
E = 4.32e8; nu = 0; surface self-weight = 90; regular MITC4+ quadrilateral meshes; two-rank MPI.
Parameter values
| Parameter | Value |
|---|
| Radius | 25 |
| Full length | 50 |
| Half angle deg | 40 |
| Thickness | 0.25 |
Results
| Quantity | Value |
|---|
| Reference displacement | -0.3024 |
| Finest error vs reference (%) | 0.6229 |
| Finest deviation from published mitc4plus (%) | 0.2038 |
| Pass | Yes |
Runs
| N | Elements | Dofs | Vertical displacement | Normalized displacement | Reference displacement | Error vs reference (%) |
|---|
| 4 | 16 | 125 | -0.2849 | 0.9423 | -0.3024 | 5.7726 |
| 8 | 64 | 405 | -0.2941 | 0.9724 | -0.3024 | 2.7591 |
| 16 | 256 | 1,445 | -0.299 | 0.9886 | -0.3024 | 1.14 |
| 32 | 1,024 | 5,445 | -0.3005 | 0.9938 | -0.3024 | 0.6229 |
Assessment
The vertical displacement at the midpoint of the free edge is tracked through four mesh levels and compared with both the accepted -0.3024 reference and the published MITC4+ convergence sequence.
Structural / Modal analysis
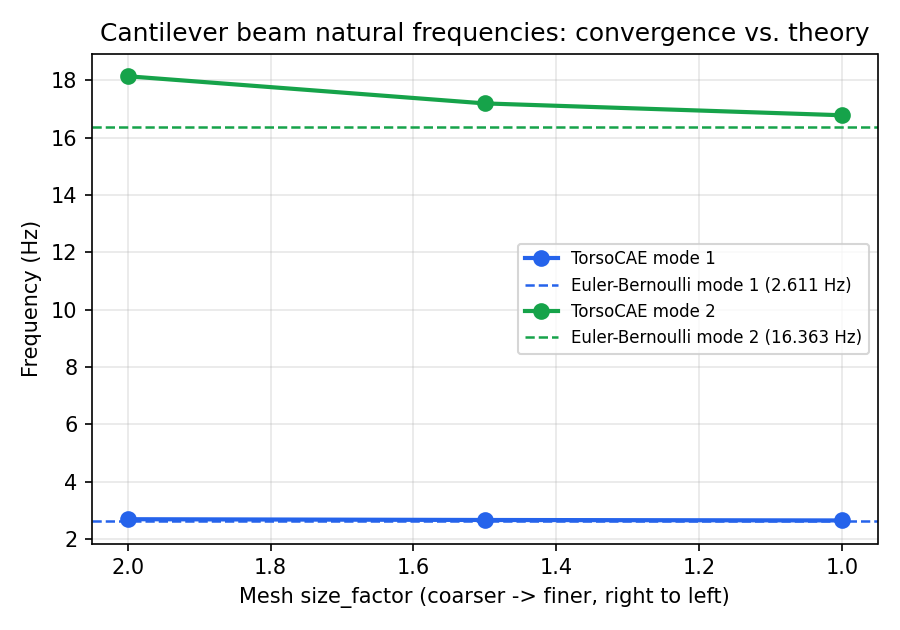
Cantilever natural frequencies
Euler-Bernoulli bending frequencies
Criterion met
Quantitative comparison
Modes 1 and 2: 1.19% and 2.58% frequency deviation
Geometry
2.0 x 0.1 x 0.0125 m slender solid cantilever.
Model parameters
Quadratic hexahedral discretization; fixed root; sparse generalized stiffness-mass eigenproblem.
Assessment method
The first two bending frequencies are tracked through mesh refinement and compared with the analytical beam frequencies.
Overview
Validated against Euler-Bernoulli bending frequencies.
Headline comparison — Modes 1 and 2: 1.19% and 2.58% frequency deviation.
Geometry and simulation setup
2.0 x 0.1 x 0.0125 m slender solid cantilever.
Quadratic hexahedral discretization; fixed root; sparse generalized stiffness-mass eigenproblem.
Parameter values
| Parameter | Value |
|---|
| Analytical hz | 2.611, 16.3629, 45.8168 |
| N modes compared | 2 |
| L m | 2 |
| Cross section m | 0.1, 0.0125 |
| E Pa | 2.1e+11 |
| Nu | 0.3 |
| Rho kg m3 | 7,850 |
Results
| Quantity | Value |
|---|
| Final error (%) | 1.1881, 2.5801 |
| Pass | Yes |
Mesh convergence
| Size factor | Elapsed s |
|---|
| 2 | 8.72 |
| 1.5 | 34.5825 |
| 1 | 196.9461 |
Assessment
The first two bending frequencies are tracked through mesh refinement and compared with the analytical beam frequencies.
Structural / Modal analysis
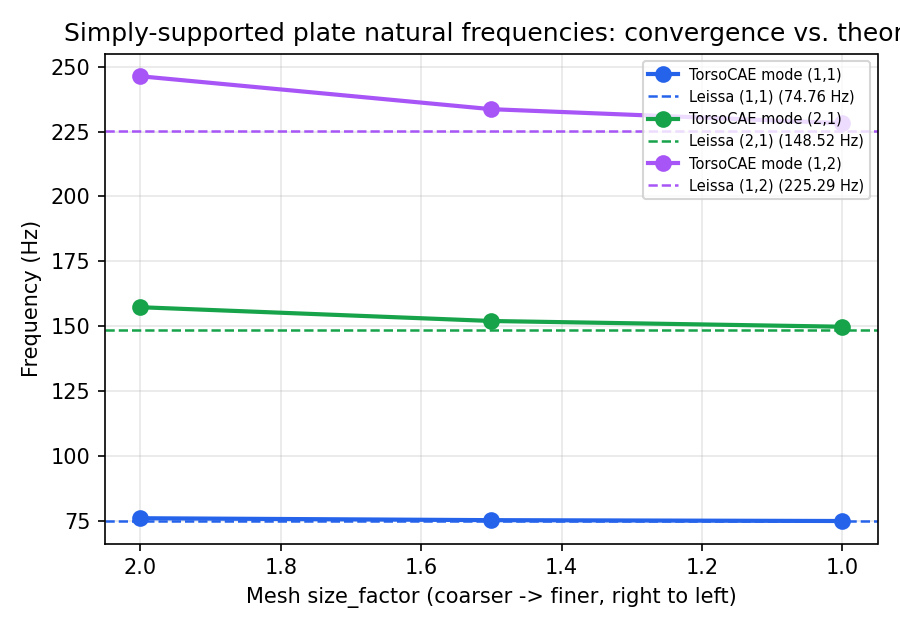
Simply-supported plate frequencies
Leissa plate-frequency solution
Criterion met
Quantitative comparison
First three modes: 0.17%, 0.84% and 1.30% frequency deviation
Geometry
1.0 x 0.7 x 0.01 m thin rectangular solid plate.
Model parameters
Quadratic hexahedral discretization; simply-supported edge constraints; sparse generalized eigenproblem.
Assessment method
Three identified bending modes are compared with analytical thin-plate frequencies across mesh refinement.
Overview
Validated against Leissa plate-frequency solution.
Headline comparison — First three modes: 0.17%, 0.84% and 1.30% frequency deviation.
Geometry and simulation setup
1.0 x 0.7 x 0.01 m thin rectangular solid plate.
Quadratic hexahedral discretization; simply-supported edge constraints; sparse generalized eigenproblem.
Parameter values
| Parameter | Value |
|---|
| Analytical hz | 74.7607, 148.518, 225.2857 |
| A m | 1 |
| B m | 0.7 |
| Thickness m | 0.01 |
| E Pa | 2.1e+11 |
| Nu | 0.3 |
| Rho kg m3 | 7,850 |
Results
| Quantity | Value |
|---|
| Final error (%) | 0.1683, 0.8425, 1.3015 |
| Pass | Yes |
Mesh convergence
| Size factor | Elapsed s |
|---|
| 2 | 5.4493 |
| 1.5 | 22.4891 |
| 1 | 134.3009 |
Assessment
Three identified bending modes are compared with analytical thin-plate frequencies across mesh refinement.
Structural / Structural dynamics
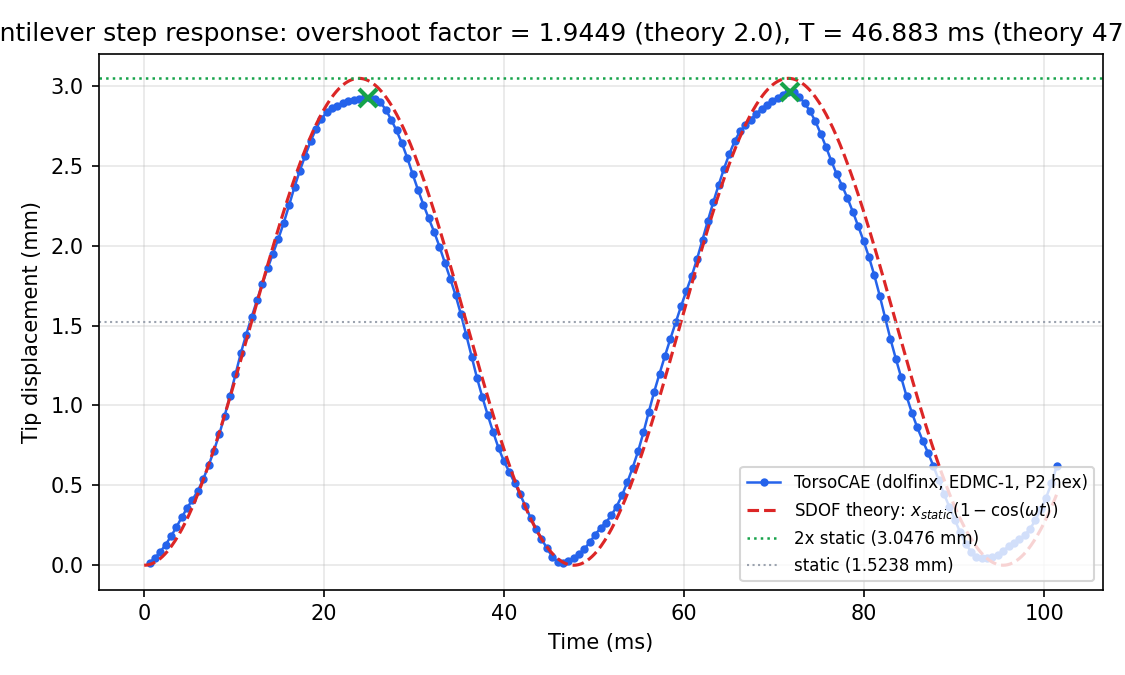
Step-loaded cantilever response
Closed-form undamped SDOF step response
Criterion met
Quantitative comparison
Overshoot: 2.76%; period: 1.76% relative deviation
Geometry
Slender steel cantilever reduced to its dominant first bending response.
Model parameters
Suddenly applied constant tip traction; 170 EDMC-1 time steps; zero algorithmic dissipation for the validation run.
Assessment method
Peak dynamic amplification and the measured oscillation period are compared independently with the equivalent SDOF solution.
Overview
Validated against Closed-form undamped SDOF step response.
Headline comparison — Overshoot: 2.76%; period: 1.76% relative deviation.
Geometry and simulation setup
Slender steel cantilever reduced to its dominant first bending response.
Suddenly applied constant tip traction; 170 EDMC-1 time steps; zero algorithmic dissipation for the validation run.
Parameter values
| Parameter | Value |
|---|
| Elapsed s | 333.9625 |
| L m | 2 |
| Cross section m | 0.1, 0.1 |
| E Pa | 2.1e+11 |
| Nu | 0.3 |
| Rho kg m3 | 7,800 |
Results
| Quantity | Value |
|---|
| Overshoot error (%) | 2.7564 |
| Period error (%) | 1.7584 |
| Final error (%) | 2.7564 |
| Pass | Yes |
Assessment
Peak dynamic amplification and the measured oscillation period are compared independently with the equivalent SDOF solution.
Structural / Structural dynamics
Beam impact frequency
Euler-Bernoulli first bending frequency
Criterion met
Quantitative comparison
First bending frequency: 1.15% relative deviation
Geometry
2.0 x 0.1 x 0.1 m solid cantilever.
Model parameters
Step-like end loading; 420 transient steps at dt = 7.9537e-4 s; frequency extracted from the displacement spectrum.
Assessment method
The dominant FFT peak of the transient response is compared with the analytical first bending frequency.
Overview
Validated against Euler-Bernoulli first bending frequency.
Headline comparison — First bending frequency: 1.15% relative deviation.
Geometry and simulation setup
2.0 x 0.1 x 0.1 m solid cantilever.
Step-like end loading; 420 transient steps at dt = 7.9537e-4 s; frequency extracted from the displacement spectrum.
Parameter values
| Parameter | Value |
|---|
| Elapsed s | 1,182.2887 |
| L m | 2 |
| Cross section m | 0.1, 0.1 |
| E Pa | 2.1e+11 |
| Nu | 0.3 |
| Rho kg m3 | 7,800 |
Results
| Quantity | Value |
|---|
| Error (%) | 1.1541 |
| Final error (%) | 1.1541 |
| Pass | Yes |
Assessment
The dominant FFT peak of the transient response is compared with the analytical first bending frequency.
Thermal / Steady conduction
One-dimensional slab conduction
Exact linear Fourier-conduction solution
Criterion met
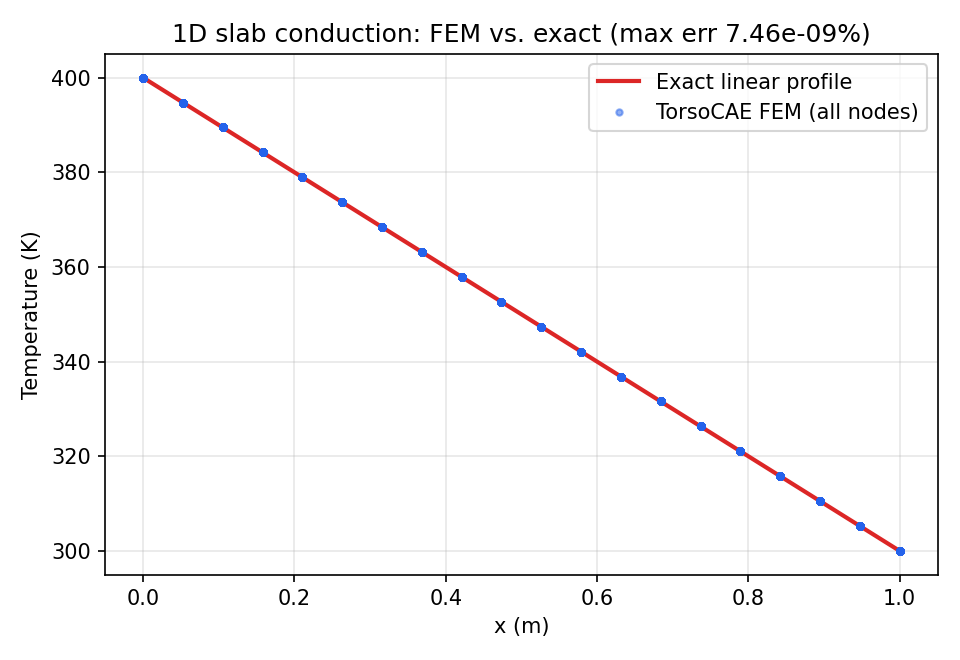
Quantitative comparison
Agreement within 7.5e-9% for temperature and 2.1e-7% for heat flux
Geometry
Rectangular slab with one-dimensional heat flow between opposite faces.
Model parameters
Constant isotropic conductivity; prescribed hot and cold face temperatures; adiabatic remaining faces.
Assessment method
Temperature at every node and the recovered conductive heat flux are compared with the exact linear profile.
Overview
Validated against Exact linear Fourier-conduction solution.
Reference: Standard 1D steady-state Fourier conduction (textbook exact solution)
Headline comparison — Agreement within 7.5e-9% for temperature and 2.1e-7% for heat flux.
Geometry and simulation setup
Rectangular slab with one-dimensional heat flow between opposite faces.
Constant isotropic conductivity; prescribed hot and cold face temperatures; adiabatic remaining faces.
Parameter values
| Parameter | Value |
|---|
| N nodes | 8,000 |
| Elapsed s | 3.4254 |
| Lx m | 1 |
| Ly m | 0.1 |
| Lz m | 0.1 |
| K W mK | 50 |
Results
FEM temperature field at every mesh node compared to the exact linear profile T(x) = T_hot + (T_cold-T_hot)*x/L; FEM heat flux magnitude (saved per-cell in the npz) compared to the exact uniform flux q = k*(T_hot-T_cold)/L.
| Quantity | Value |
|---|
| Q exact W m2 | 5,000 |
| Max temp error (%) | 7.463e-09 |
| Max flux error (%) | 2.074e-07 |
| Pass | Yes |
Assessment
Temperature at every node and the recovered conductive heat flux are compared with the exact linear profile.
Thermal / Steady conduction
Cylindrical wall conduction
Exact logarithmic radial Fourier solution
Criterion met
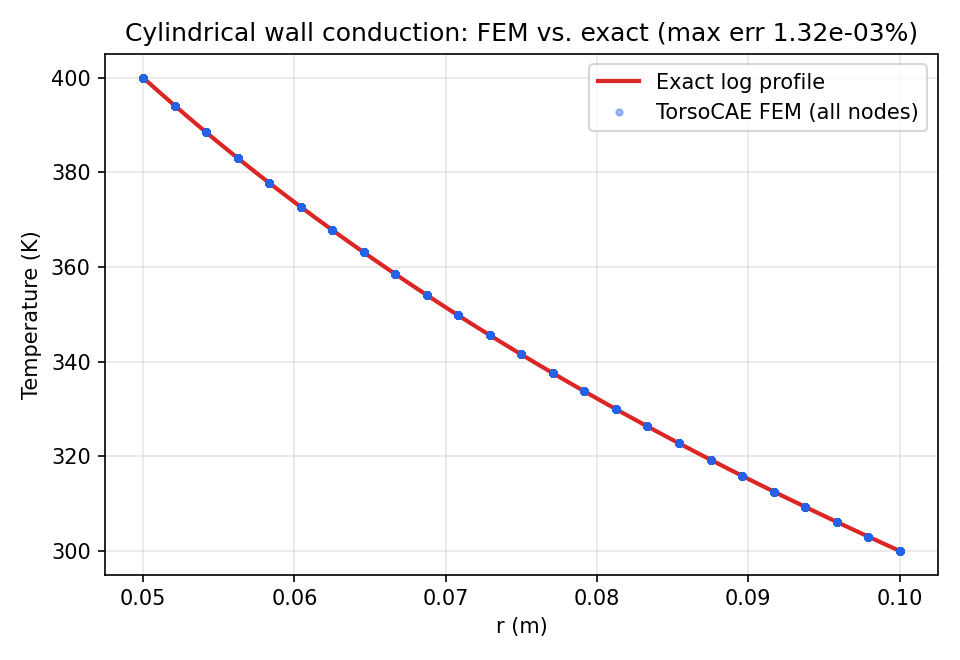
Quantitative comparison
Temperature: 0.0013%; median heat flux: 0.0078% relative deviation
Geometry
90-degree hollow-cylinder wedge with radii 0.05 and 0.10 m and 0.02 m axial length.
Model parameters
k = 50 W/(m K); inner wall at 400 K; outer wall at 300 K; radial cut and axial faces adiabatic.
Assessment method
Nodal temperature and cell heat flux are compared with the exact logarithmic radial profiles.
Overview
Validated against Exact logarithmic radial Fourier solution.
Reference: Standard 1D radial Fourier conduction in a hollow cylinder (textbook exact solution)
Headline comparison — Temperature: 0.0013%; median heat flux: 0.0078% relative deviation.
Geometry and simulation setup
90-degree hollow-cylinder wedge with radii 0.05 and 0.10 m and 0.02 m axial length.
k = 50 W/(m K); inner wall at 400 K; outer wall at 300 K; radial cut and axial faces adiabatic.
Parameter values
| Parameter | Value |
|---|
| N nodes | 15,625 |
| Elapsed s | 2.7001 |
| A m | 0.05 |
| B m | 0.1 |
| Axial slice m | 0.02 |
| Model | 90-degree wedge |
| K W mK | 50 |
Results
FEM temperature at every mesh node compared to the exact logarithmic profile T(r) = T_in + (T_out-T_in)*ln(r/a)/ln(b/a); FEM heat flux magnitude (per-cell) compared to the exact q(r) = k*(T_in-T_out)/(r*ln(b/a)) (median relative error reported for flux, since DG0 cell-center flux samples very close to the curved boundaries are mesh-resolution-limited, not a solver defect -- see README).
| Quantity | Value |
|---|
| Max temp error (%) | 0.0013 |
| Median flux error (%) | 0.0078 |
| Pass | Yes |
Assessment
Nodal temperature and cell heat flux are compared with the exact logarithmic radial profiles.
Thermal / Thermal stress
Restrained thermal expansion
sigma = -E alpha deltaT
Criterion met
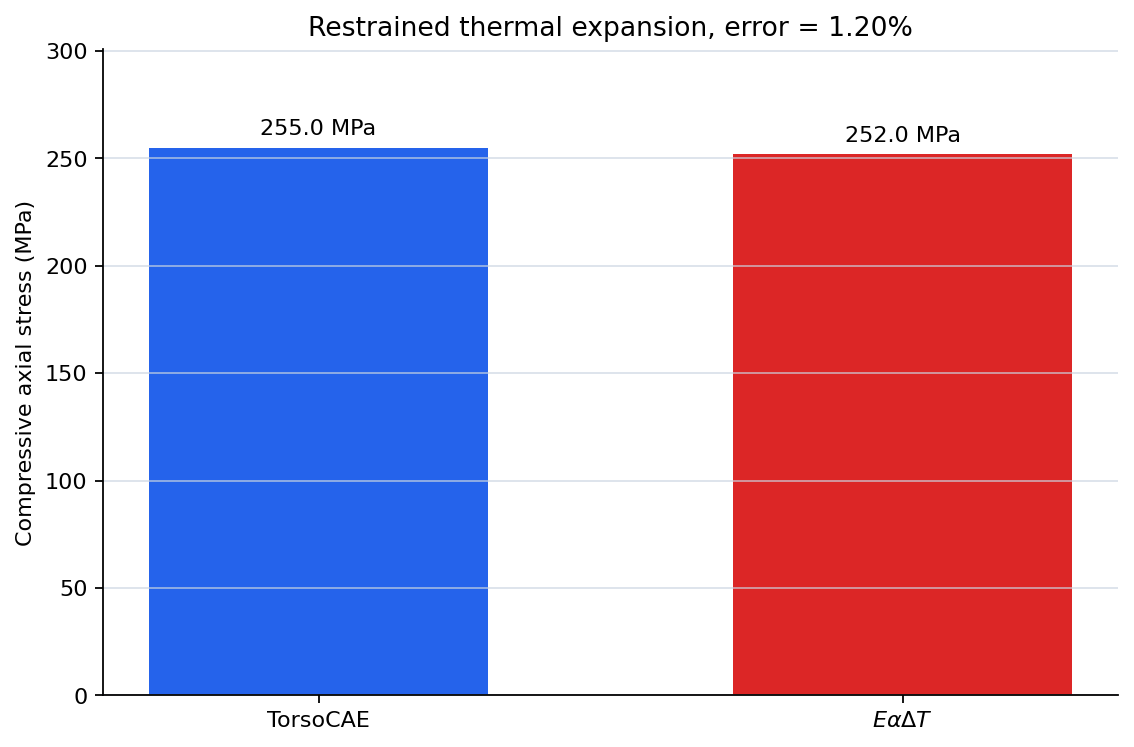
Quantitative comparison
Axial thermal stress: 1.20% relative deviation
Geometry
1.0 m bar with a 0.05 x 0.05 m square cross-section.
Model parameters
E = 210 GPa; nu = 0.3; alpha = 12e-6 1/K; uniform 100 K rise; both ends restrained axially.
Assessment method
Interior axial stress is compared with the exact fully restrained thermal-expansion stress, away from end effects.
Overview
Validated against sigma = -E alpha deltaT.
Reference: Standard restrained thermal expansion result, sigma = -E*alpha*delta_T (e.g. Boresi & Schmidt, Advanced Mechanics of Materials)
Headline comparison — Axial thermal stress: 1.20% relative deviation.
Geometry and simulation setup
1.0 m bar with a 0.05 x 0.05 m square cross-section.
E = 210 GPa; nu = 0.3; alpha = 12e-6 1/K; uniform 100 K rise; both ends restrained axially.
Parameter values
| Parameter | Value |
|---|
| Delta T K | 100 |
| Sigma fem Pa | -2.55e+08 |
| Elapsed s | 54.2163 |
| L m | 1 |
| Cross section m | 0.05, 0.05 |
| E Pa | 2.1e+11 |
| Nu | 0.3 |
| Alpha 1 K | 1.2e-05 |
| K W mK | 50 |
| T ref K | 293.15 |
Results
Temperature forced uniform (fixed_temp on all 6 faces at the same value); axial displacement restrained at both ends, lateral faces free; stress read directly from the interior (mid-bar) stress field, well away from either end.
| Quantity | Value |
|---|
| Sigma exact Pa | -2.52e+08 |
| Error (%) | 1.1973 |
| Temp uniformity max deviation K | 1.044e-05 |
| Pass | Yes |
Assessment
Interior axial stress is compared with the exact fully restrained thermal-expansion stress, away from end effects.
Thermal / Thermal stress
Timoshenko bimetal strip
Timoshenko (1925), equal-modulus special case
Criterion met
Quantitative comparison
Thermally induced tip deflection: 1.28% relative deviation
Geometry
0.5 x 0.02 x 0.02 m two-layer cantilever strip.
Model parameters
E = 150 GPa in both layers; alpha = 19e-6 and 12e-6 1/K; uniform 100 K rise; quadratic elements.
Assessment method
Computed thermally induced curvature and tip displacement are compared with the independently derived equal-thickness Timoshenko formula.
Overview
Validated against Timoshenko (1925), equal-modulus special case.
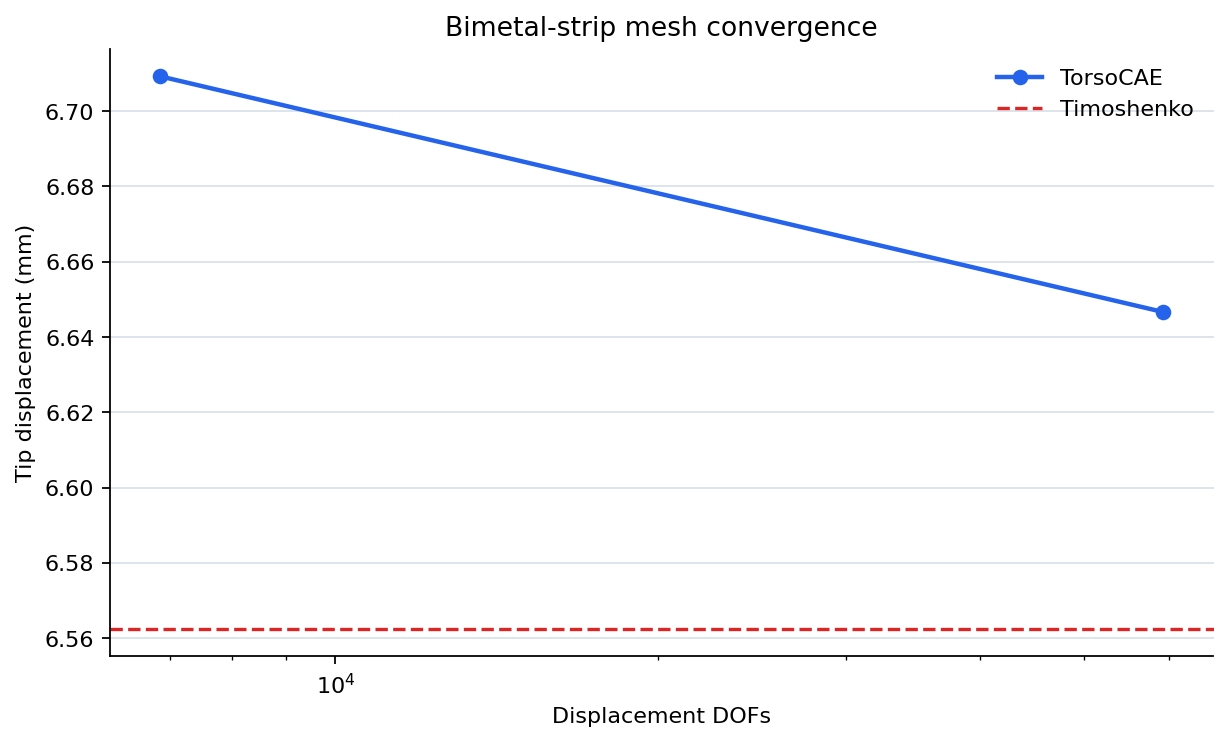
Reference: Timoshenko, S. (1925) 'Analysis of Bi-Metal Thermostats', J. Opt. Soc. Am. 11(3); equal-thickness equal-modulus (n=m=1) special case kappa=1.5*(alpha1-alpha2)*deltaT/h, derived here independently via composite-beam equilibrium (N=0, M=0) and cross-checked against that known special case.
Headline comparison — Thermally induced tip deflection: 1.28% relative deviation.
Geometry and simulation setup
0.5 x 0.02 x 0.02 m two-layer cantilever strip.
E = 150 GPa in both layers; alpha = 19e-6 and 12e-6 1/K; uniform 100 K rise; quadratic elements.
Parameter values
| Parameter | Value |
|---|
| Delta T K | 100 |
| Kappa 1 per m | 0.0525 |
| L m | 0.5 |
| Width m | 0.02 |
| Total thickness m | 0.02 |
| E Pa | 1.5e+11 |
| Nu | 0.3 |
| Alpha bottom 1 K | 1.9e-05 |
| Alpha top 1 K | 1.2e-05 |
| K W mK | 100 |
| T ref K | 293.15 |
Results
| Quantity | Value |
|---|
| Tip error (%) | 1.2819 |
| Temp uniformity max deviation K | 2.429e-10 |
| Pass | Yes |
Runs
| Size factor | N dofs | Tip dz exact m | Tip dz fem m | Tip error (%) | Temp uniformity max deviation K | Max von mises pa |
|---|
| 1 | 6,859 | 0.0066 | 0.0067 | 2.2361 | 1.011e-10 | 5.407e+07 |
| 0.5 | 59,319 | 0.0066 | 0.0066 | 1.2819 | 2.429e-10 | 8.594e+07 |
Assessment
Computed thermally induced curvature and tip displacement are compared with the independently derived equal-thickness Timoshenko formula.
Coupled / Fluid-structure interaction
Turek-Hron FSI2 self-excited flapping
Turek and Hron (2006); FEATFLOW reference data
Criterion met
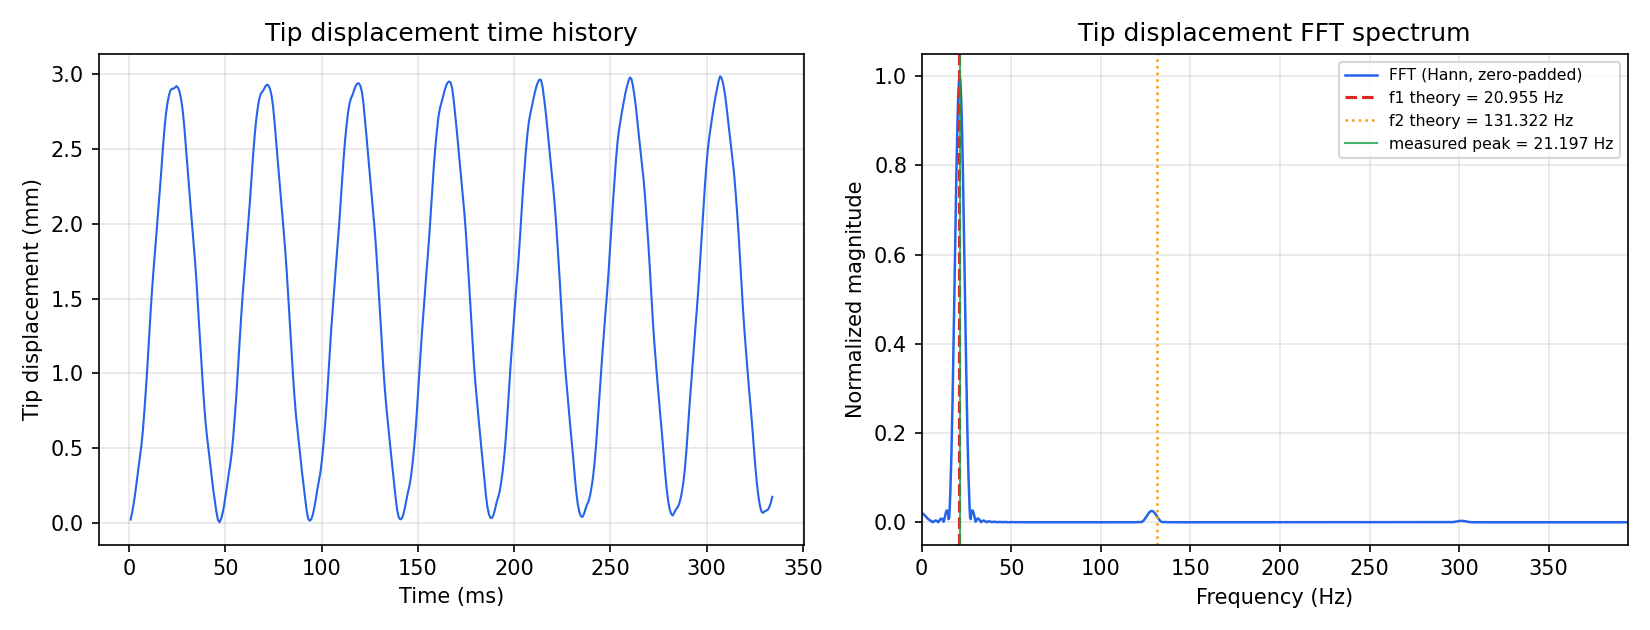
Quantitative comparison
Point-A response frequency within 0.6% and amplitude within 2.2% of the FEATFLOW reference
Geometry
Turek-Hron channel: rigid cylinder (r=0.05m) with a thin elastic flag (0.35x0.02m) clamped to its downstream side, in a 2.5x0.41m quasi-2D channel.
Model parameters
rho_fluid=1000, mu=1.0 (Re=100); rho_solid=10000, E=1.4 MPa, nu=0.4; parabolic inlet ramped to full FSI2 profile over 2s; dt=0.002s; Bossak fluid+solid time integration, MVQN coupling, Dirichlet-Neumann interface (journals/cfd_fsi_turek_hron_like2.py).
Assessment method
Point A (flag tip) response is tracked via the partitioned coupling loop's own per-step converged interface-displacement magnitude, compared against the FEATFLOW reference |Uy| envelope (frequency and amplitude, extracted by peak clustering / zero-crossing on both series). The limit cycle is checked for settling by comparing two independent post-transient time windows (agreeing to <0.1%) before comparison.
Overview
Validated against Turek and Hron (2006); FEATFLOW reference data.
Reference: Turek, S., Hron, J. (2006), Proposal for Numerical Benchmarking of FSI; official FSI2 time series from wwwold.mathematik.tu-dortmund.de/~featflow.
Headline comparison — Point-A response frequency within 0.6% and amplitude within 2.2% of the FEATFLOW reference.
Geometry and simulation setup
Turek-Hron channel: rigid cylinder (r=0.05m) with a thin elastic flag (0.35x0.02m) clamped to its downstream side, in a 2.5x0.41m quasi-2D channel.
rho_fluid=1000, mu=1.0 (Re=100); rho_solid=10000, E=1.4 MPa, nu=0.4; parabolic inlet ramped to full FSI2 profile over 2s; dt=0.002s; Bossak fluid+solid time integration, MVQN coupling, Dirichlet-Neumann interface.
Parameter values
| Parameter | Value |
|---|
| rho_fluid kg/m3 | 1000 |
| mu_fluid Pa s | 1.0 |
| Re | 100 |
| rho_solid kg/m3 | 10000 |
| E_solid Pa | 1.4e+06 |
| nu_solid | 0.4 |
| dt s | 0.002 |
| Cylinder radius m | 0.05 |
| Flag length x height m | 0.35, 0.02 |
Results
Point A response, settled window (t>9.7s, verified stable across two independent sub-windows to <0.1%).
| Quantity | TorsoCAE | FEATFLOW reference (Uy) | Relative error (%) |
|---|
| Frequency (Hz) | 1.920 | 1.931 | 0.55 |
| Amplitude (mm) | 83.5 | 81.7 | 2.21 |
| Mean offset (mm) | 1.28 | 1.70 | — |
| Pass | Yes | — | — |
Assessment
Frequency and amplitude of the self-excited flapping response agree with the published FEATFLOW FSI2 reference to within 0.6% and 2.2% respectively, well inside the 10% tolerance used across TorsoCAE's FSI benchmarks. The small amplitude offset is consistent with the measured quantity combining the flag tip's X and Y displacement (the reference's own Ux is genuinely nonzero, -2 to -28mm) rather than reporting Uy alone.